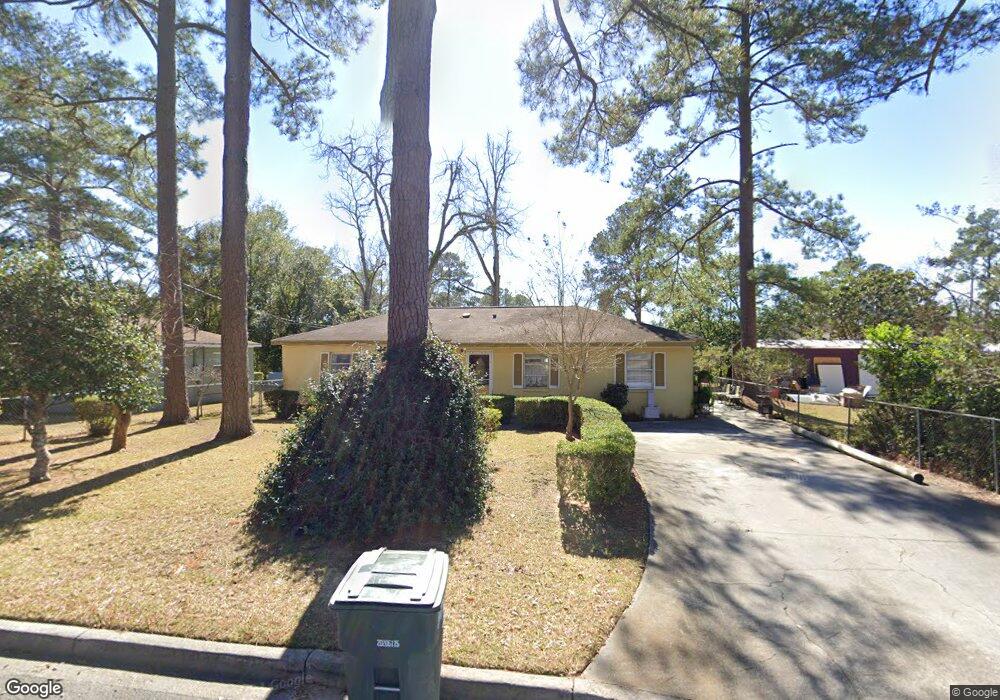
304 Pear St Thomasville, GA 31792
Estimated Value: $108,273 - $139,000
--
Bed
1
Bath
1,228
Sq Ft
$105/Sq Ft
Est. Value
About This Home
This home is located at 304 Pear St, Thomasville, GA 31792 and is currently estimated at $128,568, approximately $104 per square foot. 304 Pear St is a home located in Thomas County with nearby schools including Thomasville High School, Brookwood School, and Thomasville Christian School.
Ownership History
Date
Name
Owned For
Owner Type
Purchase Details
Closed on
Mar 18, 2010
Sold by
Miller Dyson Anita Jo
Bought by
Miller Mary Ellen
Current Estimated Value
Purchase Details
Closed on
Mar 12, 2010
Sold by
Miller Willie James and Miller Mary Ellen
Bought by
Miller Mary Ellen
Create a Home Valuation Report for This Property
The Home Valuation Report is an in-depth analysis detailing your home's value as well as a comparison with similar homes in the area
Home Values in the Area
Average Home Value in this Area
Purchase History
| Date | Buyer | Sale Price | Title Company |
|---|---|---|---|
| Miller Mary Ellen | -- | -- | |
| Miller Mary Ellen | -- | -- |
Source: Public Records
Tax History Compared to Growth
Tax History
| Year | Tax Paid | Tax Assessment Tax Assessment Total Assessment is a certain percentage of the fair market value that is determined by local assessors to be the total taxable value of land and additions on the property. | Land | Improvement |
|---|---|---|---|---|
| 2024 | $563 | $31,221 | $2,650 | $28,571 |
| 2023 | $532 | $29,251 | $2,650 | $26,601 |
| 2022 | $202 | $24,930 | $2,305 | $22,625 |
| 2021 | $184 | $21,217 | $2,304 | $18,913 |
| 2020 | $186 | $21,000 | $2,305 | $18,695 |
| 2019 | $172 | $19,554 | $2,305 | $17,249 |
| 2018 | $173 | $19,424 | $2,305 | $17,119 |
| 2017 | $176 | $19,379 | $2,051 | $17,328 |
| 2016 | $174 | $19,191 | $2,051 | $17,140 |
| 2015 | $168 | $18,573 | $1,913 | $16,660 |
| 2014 | $165 | $18,176 | $1,913 | $16,263 |
| 2013 | -- | $18,176 | $1,912 | $16,263 |
Source: Public Records
Map
Nearby Homes