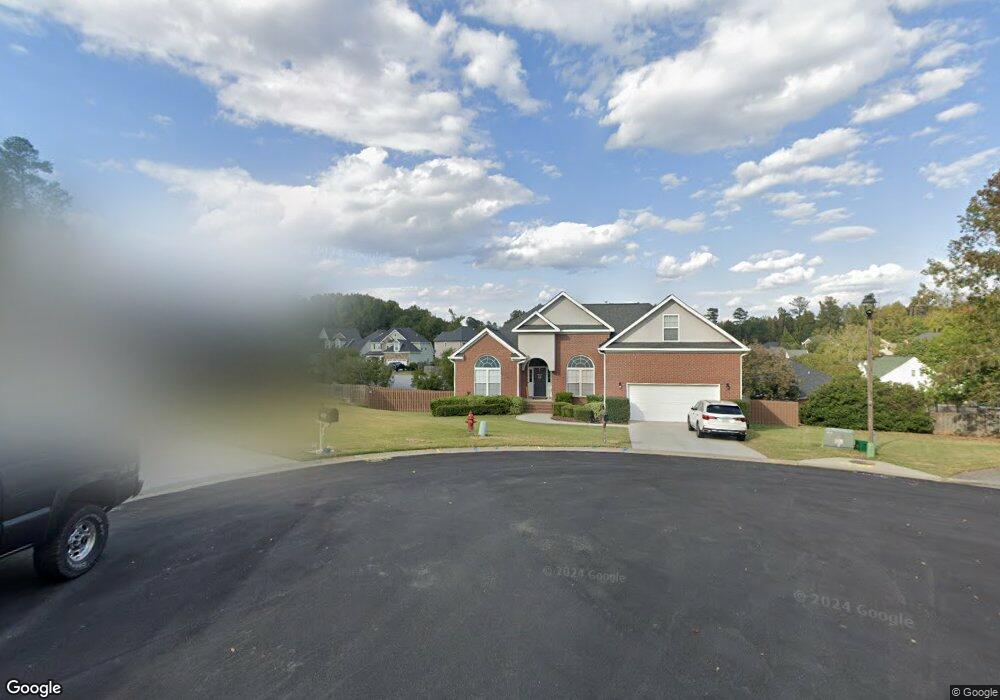
304 Peregrine Ct Augusta, GA 30907
Estimated Value: $327,381 - $343,000
4
Beds
2
Baths
2,220
Sq Ft
$152/Sq Ft
Est. Value
About This Home
This home is located at 304 Peregrine Ct, Augusta, GA 30907 and is currently estimated at $336,845, approximately $151 per square foot. 304 Peregrine Ct is a home located in Columbia County with nearby schools including Northmore Elementary School, Lincoln Elementary School, and Blue Ridge Elementary School.
Ownership History
Date
Name
Owned For
Owner Type
Purchase Details
Closed on
Dec 19, 2002
Sold by
Builders First Inc
Bought by
Gore Reginald and Gore Teresa
Current Estimated Value
Home Financials for this Owner
Home Financials are based on the most recent Mortgage that was taken out on this home.
Original Mortgage
$163,098
Outstanding Balance
$68,443
Interest Rate
5.92%
Mortgage Type
VA
Estimated Equity
$268,402
Purchase Details
Closed on
Apr 25, 2002
Sold by
First Bank Mtg
Bought by
T & F Developers Inc
Home Financials for this Owner
Home Financials are based on the most recent Mortgage that was taken out on this home.
Original Mortgage
$112,500
Interest Rate
7.07%
Purchase Details
Closed on
Apr 19, 2002
Sold by
T & F Developers Inc
Bought by
Builders First Inc
Home Financials for this Owner
Home Financials are based on the most recent Mortgage that was taken out on this home.
Original Mortgage
$112,500
Interest Rate
7.07%
Create a Home Valuation Report for This Property
The Home Valuation Report is an in-depth analysis detailing your home's value as well as a comparison with similar homes in the area
Home Values in the Area
Average Home Value in this Area
Purchase History
| Date | Buyer | Sale Price | Title Company |
|---|---|---|---|
| Gore Reginald | $159,900 | -- | |
| T & F Developers Inc | -- | -- | |
| Builders First Inc | $20,400 | -- |
Source: Public Records
Mortgage History
| Date | Status | Borrower | Loan Amount |
|---|---|---|---|
| Open | Gore Reginald | $163,098 | |
| Previous Owner | Builders First Inc | $112,500 |
Source: Public Records
Tax History Compared to Growth
Tax History
| Year | Tax Paid | Tax Assessment Tax Assessment Total Assessment is a certain percentage of the fair market value that is determined by local assessors to be the total taxable value of land and additions on the property. | Land | Improvement |
|---|---|---|---|---|
| 2025 | $3,293 | $135,622 | $22,404 | $113,218 |
| 2024 | $3,327 | $130,833 | $22,404 | $108,429 |
| 2023 | $3,327 | $119,190 | $22,404 | $96,786 |
| 2022 | $2,459 | $92,395 | $16,804 | $75,591 |
| 2021 | $2,411 | $86,521 | $15,604 | $70,917 |
| 2020 | $2,431 | $85,438 | $15,504 | $69,934 |
| 2019 | $2,261 | $79,316 | $14,404 | $64,912 |
| 2018 | $2,213 | $77,328 | $14,404 | $62,924 |
| 2017 | $2,037 | $70,779 | $13,604 | $57,175 |
| 2016 | $1,943 | $69,901 | $14,080 | $55,821 |
| 2015 | $1,928 | $69,204 | $13,080 | $56,124 |
| 2014 | $1,942 | $68,884 | $12,780 | $56,104 |
Source: Public Records
Map
Nearby Homes
- 7304 Malton Ct
- 4444 Peregrine Place
- 652 King Taylor Rd
- 0 Osprey Ln Unit 546209
- 798 Osprey Ln
- 2025 Grace Ave
- 4116 Dunes Dr
- 1009 Barrett Dr
- 519 Seminole Place
- 499 Oak Chase Dr
- 500 Oak Chase Dr
- 593 Blue Ridge Crossing
- 4110 Heritage Ridge
- 3812 Forest Creek Way
- 3829 Villa Ln
- 499 Crystal Creek W
- 0 Commons Dr
- 511 Crystal Creek W
- 513 Crystal Creek W
- 516 McKinnes Park
- 302 Peregrine Ct
- 305 Peregrine Ct
- 4417 Peregrine Place
- 4419 Peregrine Place
- 300 Peregrine Ct
- 4421 Peregrine Place
- 303 Peregrine Ct
- 545 Meldon Rd
- 301 Peregrine Ct
- 4415 Peregrine Place
- 541 Meldon Rd
- 4423 Peregrine Place
- 4445 Peregrine Place
- 546 Meldon Rd
- 4427 Peregrine Place
- 4420 Peregrine Place
- 4450 Peregrine Place
- 4413 Peregrine Place
- 4429 Peregrine Place
- 4414 Peregrine Place