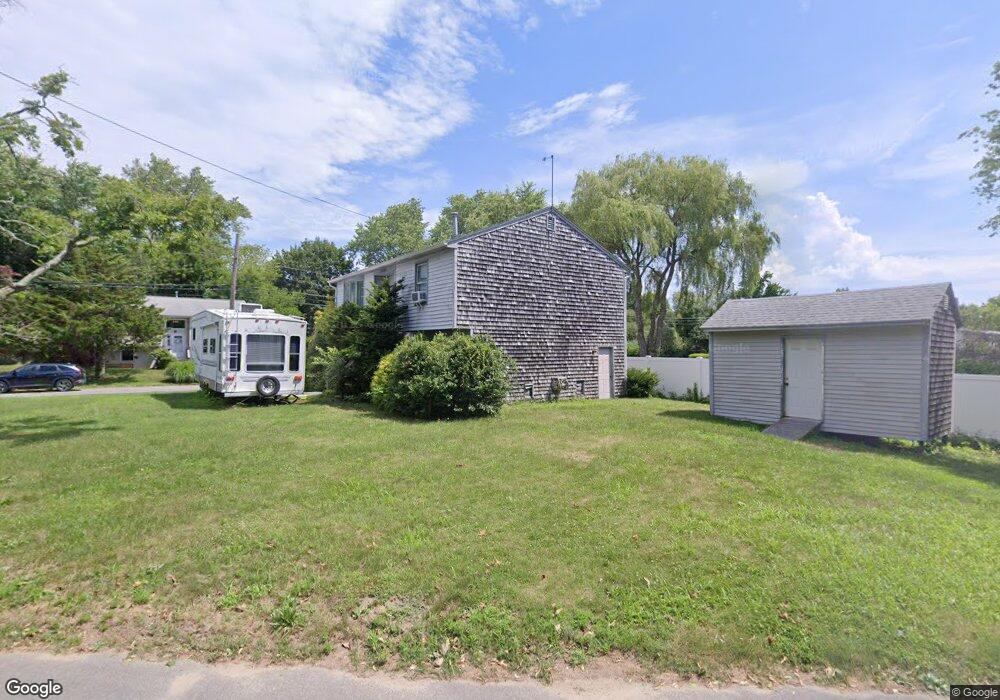
304 Point Ave Warwick, RI 02889
Conimicut-Shawomet NeighborhoodEstimated Value: $371,000 - $401,000
2
Beds
2
Baths
872
Sq Ft
$448/Sq Ft
Est. Value
About This Home
This home is located at 304 Point Ave, Warwick, RI 02889 and is currently estimated at $390,472, approximately $447 per square foot. 304 Point Ave is a home located in Kent County with nearby schools including Saint Kevin School and Bishop Hendricken High School.
Ownership History
Date
Name
Owned For
Owner Type
Purchase Details
Closed on
Feb 27, 2017
Sold by
Davidson Kenneth D
Bought by
Davidson Kenneth D and Davidson Gail L
Current Estimated Value
Purchase Details
Closed on
Jun 29, 1993
Sold by
Riffle Delmas H and Riffle Patricia
Bought by
Davidson Kenneth D
Purchase Details
Closed on
Feb 13, 1991
Sold by
Park Ave Dev Corp
Bought by
Riffle Delmas H
Create a Home Valuation Report for This Property
The Home Valuation Report is an in-depth analysis detailing your home's value as well as a comparison with similar homes in the area
Home Values in the Area
Average Home Value in this Area
Purchase History
| Date | Buyer | Sale Price | Title Company |
|---|---|---|---|
| Davidson Kenneth D | -- | -- | |
| Davidson Kenneth D | $94,000 | -- | |
| Davidson Kenneth D | $94,000 | -- | |
| Riffle Delmas H | $100,000 | -- | |
| Riffle Delmas H | $100,000 | -- |
Source: Public Records
Mortgage History
| Date | Status | Borrower | Loan Amount |
|---|---|---|---|
| Previous Owner | Riffle Delmas H | $35,000 | |
| Previous Owner | Riffle Delmas H | $133,700 | |
| Previous Owner | Riffle Delmas H | $108,000 |
Source: Public Records
Tax History
| Year | Tax Paid | Tax Assessment Tax Assessment Total Assessment is a certain percentage of the fair market value that is determined by local assessors to be the total taxable value of land and additions on the property. | Land | Improvement |
|---|---|---|---|---|
| 2025 | $4,253 | $334,900 | $100,700 | $234,200 |
| 2024 | $4,014 | $277,400 | $83,200 | $194,200 |
| 2023 | $3,936 | $277,400 | $83,200 | $194,200 |
| 2022 | $3,703 | $197,700 | $50,200 | $147,500 |
| 2021 | $3,703 | $197,700 | $50,200 | $147,500 |
| 2020 | $3,703 | $197,700 | $50,200 | $147,500 |
| 2019 | $3,703 | $197,700 | $50,200 | $147,500 |
| 2018 | $3,195 | $153,600 | $50,200 | $103,400 |
| 2017 | $3,109 | $153,600 | $50,200 | $103,400 |
| 2016 | $3,109 | $153,600 | $50,200 | $103,400 |
| 2015 | $3,426 | $165,100 | $70,100 | $95,000 |
| 2014 | $3,312 | $165,100 | $70,100 | $95,000 |
| 2013 | $3,267 | $165,100 | $70,100 | $95,000 |
Source: Public Records
Map
Nearby Homes
- 185 Old Mill Blvd
- 309 Point Ave
- 325 Point Ave
- 295 Point Ave
- 288 Point Ave
- 317 Point Ave
- 322 Point Ave
- 282 Point Ave
- 175 Old Mill Blvd
- 0 Valentine Cir
- 113 Vohlander St
- 40 Ivan Ave
- 11 Higney Ave
- 45 Talcott Ave
- 50 Ivan Ave
- 170 Old Mill Blvd
- 32 Talcott & Shawmut
- 0 Ivan Ave
- 0 Talcott Ave
- 110 Vohlander St
Your Personal Tour Guide
Ask me questions while you tour the home.