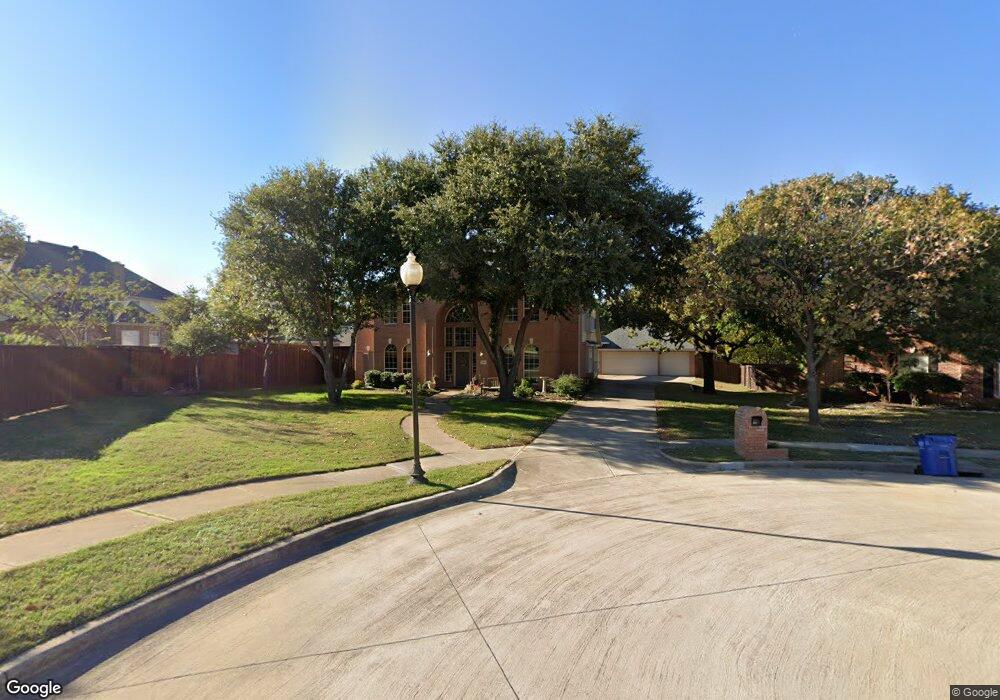
304 Quail Ct Southlake, TX 76092
Estimated Value: $939,380 - $1,072,000
4
Beds
4
Baths
3,438
Sq Ft
$287/Sq Ft
Est. Value
About This Home
This home is located at 304 Quail Ct, Southlake, TX 76092 and is currently estimated at $986,345, approximately $286 per square foot. 304 Quail Ct is a home located in Tarrant County with nearby schools including Carroll Elementary School, Don T. Durham Intermediate School, and Carroll Middle School.
Ownership History
Date
Name
Owned For
Owner Type
Purchase Details
Closed on
Jul 1, 2021
Sold by
Rose Eric G and Rose Rosa G
Bought by
Rose Eric Gregory and Rose Rosa Guadalupe
Current Estimated Value
Purchase Details
Closed on
Nov 12, 2009
Sold by
Waite Monica E and Waite Monica
Bought by
Rose Eric G and Rose Rosa G
Home Financials for this Owner
Home Financials are based on the most recent Mortgage that was taken out on this home.
Original Mortgage
$286,320
Outstanding Balance
$185,324
Interest Rate
4.83%
Mortgage Type
New Conventional
Estimated Equity
$801,021
Purchase Details
Closed on
Sep 10, 2006
Sold by
Byrne William
Bought by
Waite Monica
Purchase Details
Closed on
Dec 13, 1994
Sold by
Centennial Homes Inc
Bought by
Byrne William M and Waite Monica E
Home Financials for this Owner
Home Financials are based on the most recent Mortgage that was taken out on this home.
Original Mortgage
$186,800
Interest Rate
9%
Create a Home Valuation Report for This Property
The Home Valuation Report is an in-depth analysis detailing your home's value as well as a comparison with similar homes in the area
Home Values in the Area
Average Home Value in this Area
Purchase History
| Date | Buyer | Sale Price | Title Company |
|---|---|---|---|
| Rose Eric Gregory | -- | None Available | |
| Rose Eric G | -- | Stewart Title | |
| Waite Monica | -- | None Available | |
| Byrne William M | -- | Stewart Title |
Source: Public Records
Mortgage History
| Date | Status | Borrower | Loan Amount |
|---|---|---|---|
| Open | Rose Eric G | $286,320 | |
| Previous Owner | Byrne William M | $186,800 | |
| Closed | Byrne William M | $23,300 | |
| Closed | Waite Monica | $0 |
Source: Public Records
Tax History Compared to Growth
Tax History
| Year | Tax Paid | Tax Assessment Tax Assessment Total Assessment is a certain percentage of the fair market value that is determined by local assessors to be the total taxable value of land and additions on the property. | Land | Improvement |
|---|---|---|---|---|
| 2025 | $10,763 | $596,117 | $318,150 | $277,967 |
| 2024 | $10,763 | $733,412 | $318,150 | $415,262 |
| 2023 | $12,046 | $776,304 | $318,150 | $458,154 |
| 2022 | $12,962 | $659,799 | $212,101 | $447,698 |
| 2021 | $12,453 | $546,190 | $212,100 | $334,090 |
| 2020 | $12,061 | $546,190 | $190,890 | $355,300 |
| 2019 | $11,551 | $477,000 | $120,000 | $357,000 |
| 2018 | $10,033 | $445,000 | $120,000 | $325,000 |
| 2017 | $10,347 | $435,000 | $100,000 | $335,000 |
| 2016 | $9,406 | $435,000 | $100,000 | $335,000 |
| 2015 | $8,267 | $345,000 | $55,000 | $290,000 |
| 2014 | $8,267 | $378,000 | $55,000 | $323,000 |
Source: Public Records
Map
Nearby Homes
- 207 Killdeer Trail
- 203 Donley Ct
- 1811 Redwing Ct
- 1712 Wild Rose Way
- 2116 Camden Cir
- 1340 Meadow Glen
- 550 N Peytonville Ave
- 2530 & 2580 W Southlake Blvd
- 1807 Mesquite Ct
- 204 Southridge Lakes Pkwy
- 904 Palos Verdes Trail
- 205 Lovegrass Ln
- 1371 Holland Hill
- 2009 Montecito Trail
- 2304 Top Rail Ln
- 503 Indian Paintbrush Way
- 203 Manor Place
- 403 Presidio Ct
- 2415 Poplar Ct
- 810 Brazos Dr
- 306 Quail Ct
- 1706 Redwing Dr
- 1708 Redwing Dr
- 1710 Redwing Dr
- 302 Quail Ct
- 307 Quail Ct
- 303 Quail Ct
- 305 Quail Ct
- 1712 Redwing Dr
- 1700 Water Lily Dr
- 301 Quail Ct
- 1705 Redwing Dr
- 1701 Mesquite Rd
- 1701 Redwing Dr
- 1703 Water Lily Dr
- 1714 Redwing Dr
- 1702 Water Lily Dr
- 1703 Mesquite Rd
- 211 Killdeer Trail
- 1705 Water Lily Dr