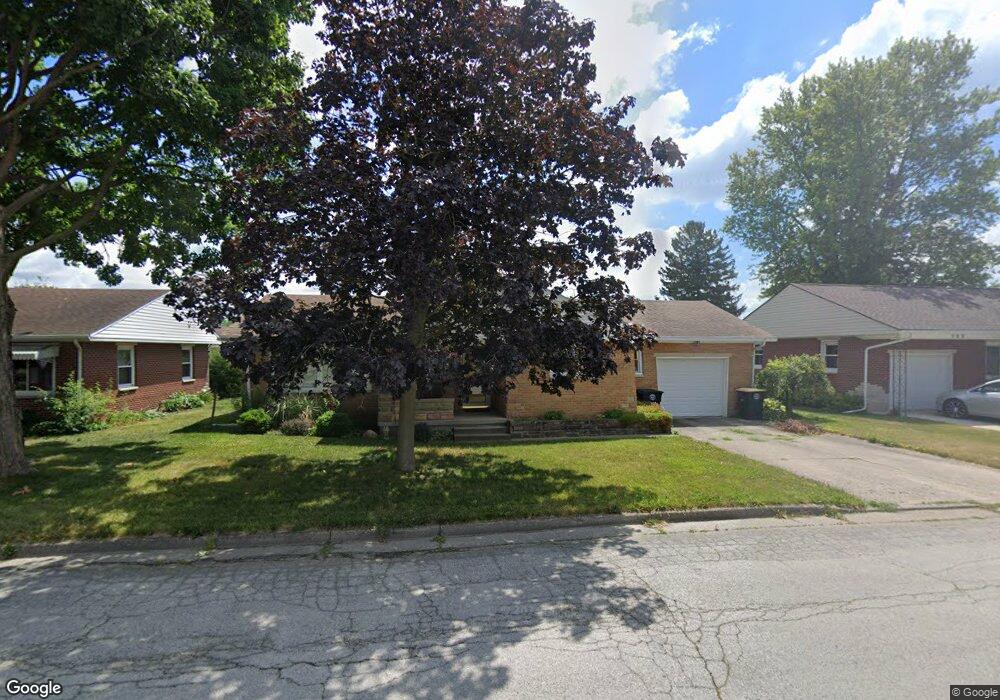
304 Richeson St Covington, OH 45318
Estimated Value: $153,000 - $191,440
2
Beds
1
Bath
1,224
Sq Ft
$144/Sq Ft
Est. Value
About This Home
This home is located at 304 Richeson St, Covington, OH 45318 and is currently estimated at $176,110, approximately $143 per square foot. 304 Richeson St is a home located in Miami County with nearby schools including Covington Elementary/Junior High School, Covington Junior High School, and Covington High School.
Ownership History
Date
Name
Owned For
Owner Type
Purchase Details
Closed on
Jun 12, 2015
Sold by
Secretary Of Housing & Urban Development
Bought by
Hand Cindy L
Current Estimated Value
Home Financials for this Owner
Home Financials are based on the most recent Mortgage that was taken out on this home.
Original Mortgage
$56,000
Outstanding Balance
$20,540
Interest Rate
3.02%
Mortgage Type
New Conventional
Estimated Equity
$155,570
Purchase Details
Closed on
Jan 12, 2015
Sold by
Smith Mark E and Smith Judith G
Bought by
Secretary Of Housing & Urban Development
Purchase Details
Closed on
Dec 21, 1998
Sold by
Davis Robert W
Bought by
Smith Mark E and Smith Judith G
Home Financials for this Owner
Home Financials are based on the most recent Mortgage that was taken out on this home.
Original Mortgage
$72,250
Interest Rate
6.96%
Mortgage Type
New Conventional
Purchase Details
Closed on
May 30, 1989
Bought by
Davis Robert W
Create a Home Valuation Report for This Property
The Home Valuation Report is an in-depth analysis detailing your home's value as well as a comparison with similar homes in the area
Home Values in the Area
Average Home Value in this Area
Purchase History
| Date | Buyer | Sale Price | Title Company |
|---|---|---|---|
| Hand Cindy L | $70,096 | Attorney | |
| Secretary Of Housing & Urban Development | -- | Attorney | |
| Smith Mark E | $87,000 | -- | |
| Davis Robert W | $59,500 | -- |
Source: Public Records
Mortgage History
| Date | Status | Borrower | Loan Amount |
|---|---|---|---|
| Open | Hand Cindy L | $56,000 | |
| Previous Owner | Smith Mark E | $72,250 |
Source: Public Records
Tax History Compared to Growth
Tax History
| Year | Tax Paid | Tax Assessment Tax Assessment Total Assessment is a certain percentage of the fair market value that is determined by local assessors to be the total taxable value of land and additions on the property. | Land | Improvement |
|---|---|---|---|---|
| 2024 | $1,795 | $47,920 | $10,750 | $37,170 |
| 2023 | $1,795 | $47,920 | $10,750 | $37,170 |
| 2022 | $1,790 | $47,920 | $10,750 | $37,170 |
| 2021 | $1,487 | $36,860 | $8,260 | $28,600 |
| 2020 | $1,490 | $36,860 | $8,260 | $28,600 |
| 2019 | $1,497 | $36,860 | $8,260 | $28,600 |
| 2018 | $1,270 | $31,220 | $6,440 | $24,780 |
| 2017 | $1,293 | $31,220 | $6,440 | $24,780 |
| 2016 | $1,276 | $31,220 | $6,440 | $24,780 |
| 2015 | $1,177 | $30,040 | $6,200 | $23,840 |
| 2014 | $1,177 | $30,040 | $6,200 | $23,840 |
| 2013 | $1,133 | $30,040 | $6,200 | $23,840 |
Source: Public Records
Map
Nearby Homes
- 698 E Broadway St
- 271 N Ludlow St
- 00 W Piqua Clay Rd
- 223 Henry Ct
- 520 N Pearl St
- 124 N Main St
- 133 W Broadway St
- 731 N Pearl St
- 501 N Main St Unit C1
- 221 S High St
- 536 S High St
- 212 Charles Ct
- 210 Charles Ct
- 206 Charles Ct
- 208 Charles Ct
- 204 Charles Ct
- 207 Charles Ct
- 205 Charles Ct
- 203 Charles Ct
- 202 Charles Ct