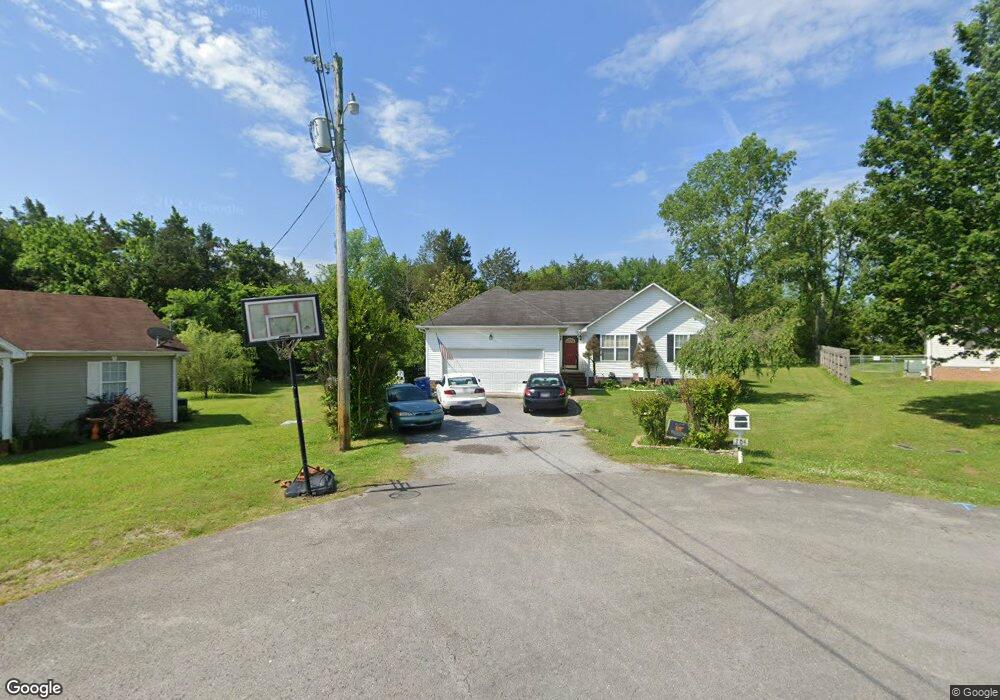
304 Russell St Shelbyville, TN 37160
Estimated Value: $298,509 - $318,000
3
Beds
2
Baths
1,408
Sq Ft
$218/Sq Ft
Est. Value
About This Home
This home is located at 304 Russell St, Shelbyville, TN 37160 and is currently estimated at $306,627, approximately $217 per square foot. 304 Russell St is a home located in Bedford County with nearby schools including South Side Elementary School, Harris Middle School, and Victory Baptist Academy.
Ownership History
Date
Name
Owned For
Owner Type
Purchase Details
Closed on
Mar 26, 2004
Sold by
Glover Chris
Bought by
Melton Sherry A
Current Estimated Value
Purchase Details
Closed on
Mar 2, 2004
Sold by
Canter Keith
Bought by
Glover Chris
Purchase Details
Closed on
Aug 8, 1997
Sold by
Warren Gordon
Bought by
Richardson Larry N and Richardson Bonni
Purchase Details
Closed on
Jul 1, 1996
Sold by
Carlton Bell H
Bought by
Warren Gordon
Purchase Details
Closed on
Dec 24, 1986
Bought by
Elbert Bell H and Elbert Landers
Create a Home Valuation Report for This Property
The Home Valuation Report is an in-depth analysis detailing your home's value as well as a comparison with similar homes in the area
Home Values in the Area
Average Home Value in this Area
Purchase History
| Date | Buyer | Sale Price | Title Company |
|---|---|---|---|
| Melton Sherry A | $75,500 | -- | |
| Glover Chris | $70,000 | -- | |
| Canter Keith | $70,000 | -- | |
| Richardson Larry N | $88,900 | -- | |
| Warren Gordon | $8,500 | -- | |
| Elbert Bell H | $25,000 | -- |
Source: Public Records
Tax History Compared to Growth
Tax History
| Year | Tax Paid | Tax Assessment Tax Assessment Total Assessment is a certain percentage of the fair market value that is determined by local assessors to be the total taxable value of land and additions on the property. | Land | Improvement |
|---|---|---|---|---|
| 2025 | -- | $43,800 | $0 | $0 |
| 2024 | -- | $43,800 | $7,750 | $36,050 |
| 2023 | $648 | $43,800 | $7,750 | $36,050 |
| 2022 | $1,714 | $43,800 | $7,750 | $36,050 |
| 2021 | $1,557 | $43,800 | $7,750 | $36,050 |
| 2020 | $1,340 | $43,800 | $7,750 | $36,050 |
| 2019 | $1,340 | $30,250 | $5,750 | $24,500 |
| 2018 | $1,309 | $30,250 | $5,750 | $24,500 |
| 2017 | $1,309 | $30,250 | $5,750 | $24,500 |
| 2016 | $1,298 | $30,250 | $5,750 | $24,500 |
| 2015 | $1,298 | $30,250 | $5,750 | $24,500 |
| 2014 | $1,081 | $27,573 | $0 | $0 |
Source: Public Records
Map
Nearby Homes