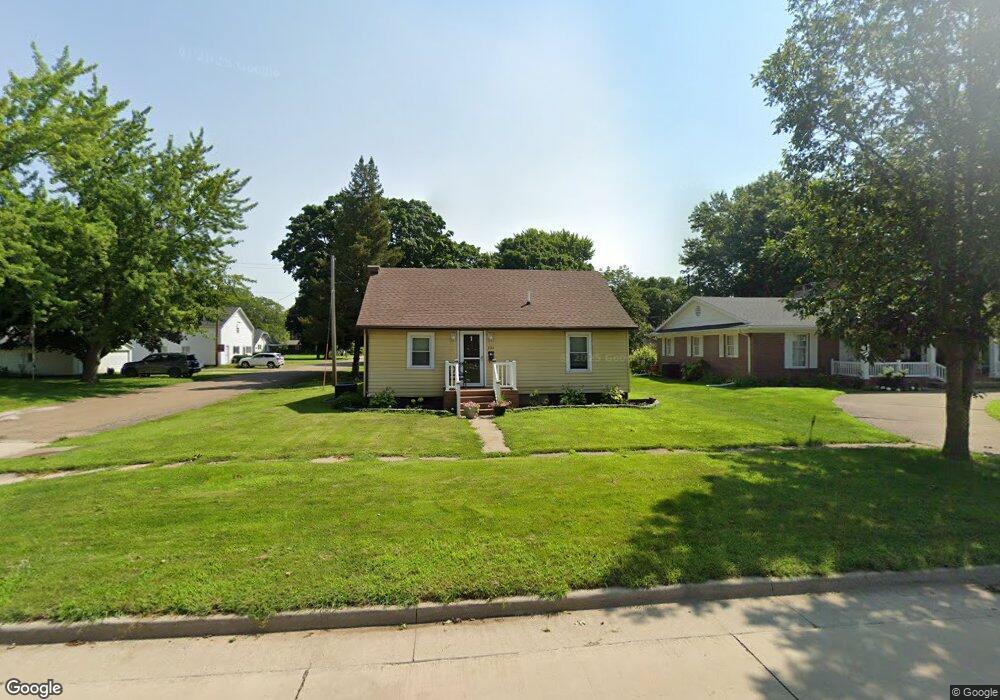
304 S 4th St Wapello, IA 52653
Estimated Value: $126,000 - $150,000
3
Beds
1
Bath
1,299
Sq Ft
$107/Sq Ft
Est. Value
About This Home
This home is located at 304 S 4th St, Wapello, IA 52653 and is currently estimated at $138,755, approximately $106 per square foot. 304 S 4th St is a home located in Louisa County with nearby schools including Wapello Elementary School and Wapello Senior High School.
Ownership History
Date
Name
Owned For
Owner Type
Purchase Details
Closed on
Mar 25, 2025
Sold by
Fletcher Thomas R
Bought by
Paris Jordan Heath and Klenk Carly Marie
Current Estimated Value
Home Financials for this Owner
Home Financials are based on the most recent Mortgage that was taken out on this home.
Original Mortgage
$121,250
Outstanding Balance
$120,629
Interest Rate
6.87%
Mortgage Type
New Conventional
Estimated Equity
$18,126
Purchase Details
Closed on
Aug 2, 2021
Sold by
Griffin Crotty A and Griffin Doris A
Bought by
Fletcher Thomas R
Home Financials for this Owner
Home Financials are based on the most recent Mortgage that was taken out on this home.
Original Mortgage
$109,000
Interest Rate
3%
Mortgage Type
New Conventional
Purchase Details
Closed on
Sep 6, 2019
Sold by
Bonnesen F Joseph and Bonnesen Carol
Bought by
Griffin Crotty A and Griffin Doris A
Purchase Details
Closed on
Aug 1, 2007
Sold by
Pforts April Ann and Pforts Edward Garrison
Bought by
Bonnesen Keith A and Bonnesen Joseph
Create a Home Valuation Report for This Property
The Home Valuation Report is an in-depth analysis detailing your home's value as well as a comparison with similar homes in the area
Home Values in the Area
Average Home Value in this Area
Purchase History
| Date | Buyer | Sale Price | Title Company |
|---|---|---|---|
| Paris Jordan Heath | $125,000 | None Listed On Document | |
| Fletcher Thomas R | $113,000 | None Available | |
| Griffin Crotty A | $77,000 | None Available | |
| Bonnesen Keith A | $71,000 | None Available |
Source: Public Records
Mortgage History
| Date | Status | Borrower | Loan Amount |
|---|---|---|---|
| Open | Paris Jordan Heath | $121,250 | |
| Previous Owner | Fletcher Thomas R | $109,000 |
Source: Public Records
Tax History Compared to Growth
Tax History
| Year | Tax Paid | Tax Assessment Tax Assessment Total Assessment is a certain percentage of the fair market value that is determined by local assessors to be the total taxable value of land and additions on the property. | Land | Improvement |
|---|---|---|---|---|
| 2025 | $1,682 | $116,720 | $8,060 | $108,660 |
| 2024 | $1,684 | $108,420 | $8,060 | $100,360 |
| 2023 | $1,256 | $108,420 | $8,060 | $100,360 |
| 2022 | $1,156 | $72,020 | $8,060 | $63,960 |
| 2021 | $1,060 | $72,020 | $8,060 | $63,960 |
| 2020 | $1,060 | $63,560 | $8,060 | $55,500 |
| 2019 | $1,236 | $60,310 | $8,060 | $52,250 |
| 2018 | $1,222 | $60,310 | $8,060 | $52,250 |
| 2017 | $1,222 | $57,050 | $0 | $0 |
| 2016 | $1,274 | $57,050 | $8,060 | $48,990 |
| 2015 | $1,274 | $57,050 | $8,060 | $48,990 |
| 2014 | $1,290 | $60,870 | $4,560 | $56,310 |
Source: Public Records
Map
Nearby Homes