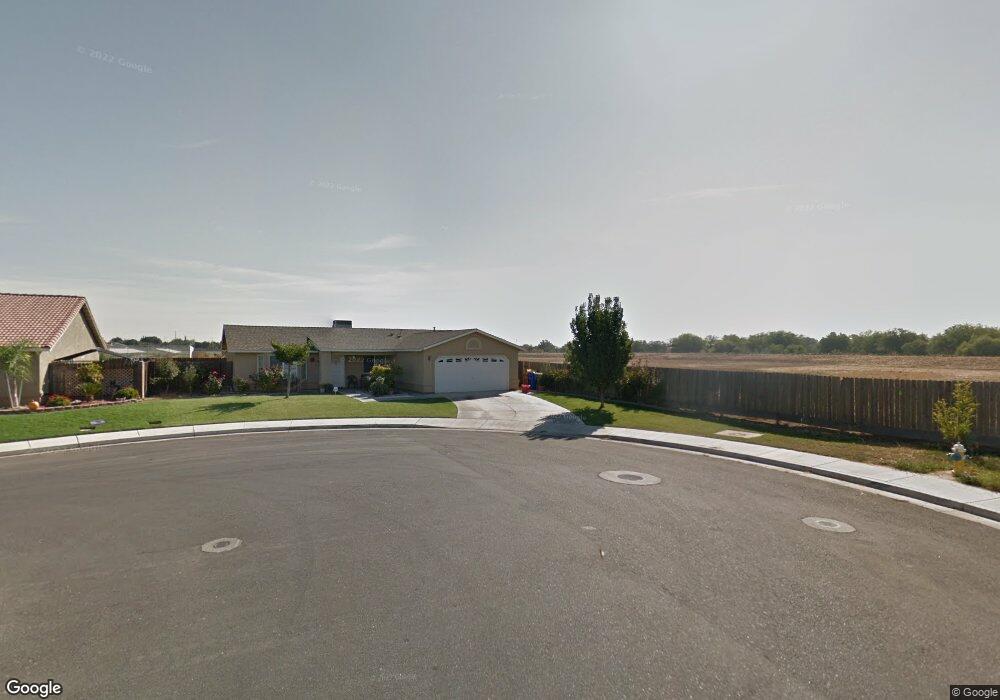
304 S Dana Ct Planada, CA 95365
Estimated Value: $287,000 - $319,748
3
Beds
2
Baths
1,313
Sq Ft
$232/Sq Ft
Est. Value
About This Home
This home is located at 304 S Dana Ct, Planada, CA 95365 and is currently estimated at $304,937, approximately $232 per square foot. 304 S Dana Ct is a home located in Merced County with nearby schools including Planada Elementary School, Cesar E. Chavez Middle School, and Granada High School.
Ownership History
Date
Name
Owned For
Owner Type
Purchase Details
Closed on
Mar 12, 2008
Sold by
Us Bank Na
Bought by
Naranjo Bulmaro C and Naranjo Fedelina
Current Estimated Value
Home Financials for this Owner
Home Financials are based on the most recent Mortgage that was taken out on this home.
Original Mortgage
$162,701
Outstanding Balance
$101,251
Interest Rate
5.72%
Mortgage Type
FHA
Estimated Equity
$203,686
Purchase Details
Closed on
Aug 27, 2007
Sold by
Basaldua Daniel and Basaldua Norma
Bought by
Us Bank Na
Purchase Details
Closed on
Jan 26, 2006
Sold by
H/S Development
Bought by
Basaldua Daniel and Basaldua Norma
Home Financials for this Owner
Home Financials are based on the most recent Mortgage that was taken out on this home.
Original Mortgage
$214,360
Interest Rate
7.12%
Mortgage Type
Fannie Mae Freddie Mac
Create a Home Valuation Report for This Property
The Home Valuation Report is an in-depth analysis detailing your home's value as well as a comparison with similar homes in the area
Home Values in the Area
Average Home Value in this Area
Purchase History
| Date | Buyer | Sale Price | Title Company |
|---|---|---|---|
| Naranjo Bulmaro C | $165,000 | Chicago Title Company | |
| Us Bank Na | $197,857 | None Available | |
| Basaldua Daniel | $268,000 | Fidelity Natl Title Co Of Ca |
Source: Public Records
Mortgage History
| Date | Status | Borrower | Loan Amount |
|---|---|---|---|
| Open | Naranjo Bulmaro C | $162,701 | |
| Previous Owner | Basaldua Daniel | $214,360 |
Source: Public Records
Tax History Compared to Growth
Tax History
| Year | Tax Paid | Tax Assessment Tax Assessment Total Assessment is a certain percentage of the fair market value that is determined by local assessors to be the total taxable value of land and additions on the property. | Land | Improvement |
|---|---|---|---|---|
| 2025 | $2,390 | $216,718 | $78,803 | $137,915 |
| 2024 | $2,390 | $212,469 | $77,258 | $135,211 |
| 2023 | $2,353 | $208,304 | $75,744 | $132,560 |
| 2022 | $2,228 | $204,220 | $74,259 | $129,961 |
| 2021 | $2,192 | $200,216 | $72,803 | $127,413 |
| 2020 | $2,148 | $198,164 | $72,057 | $126,107 |
| 2019 | $2,110 | $194,280 | $70,645 | $123,635 |
| 2018 | $1,826 | $170,000 | $40,000 | $130,000 |
| 2017 | $1,839 | $169,500 | $40,000 | $129,500 |
| 2016 | $1,546 | $140,000 | $40,000 | $100,000 |
| 2015 | $1,572 | $136,000 | $40,000 | $96,000 |
| 2014 | $1,069 | $100,000 | $30,000 | $70,000 |
Source: Public Records
Map
Nearby Homes
- 0 Santa fe Ave Unit MC25241633
- 0 Santa fe Ave
- 0 E Childs Ave Unit 225007730
- 0 E Childs Ave Unit MC24150577
- 9095 California 140
- 462 Gage St
- 9250 Latham Dr
- 478 N Sutter St
- 9513 Stanford Ave
- 37 Whealan Rd
- 411 Fancher St
- 358 Cody Ave
- 10595 Childs Ave
- 10475 Mission Ave
- 10638 Toews Ave
- 8729 Mariposa Way
- 10391 Gillette Rd
- 0 Kahlon Rd
- 4040 Vassar Ave
- 3335 S Cunningham Rd