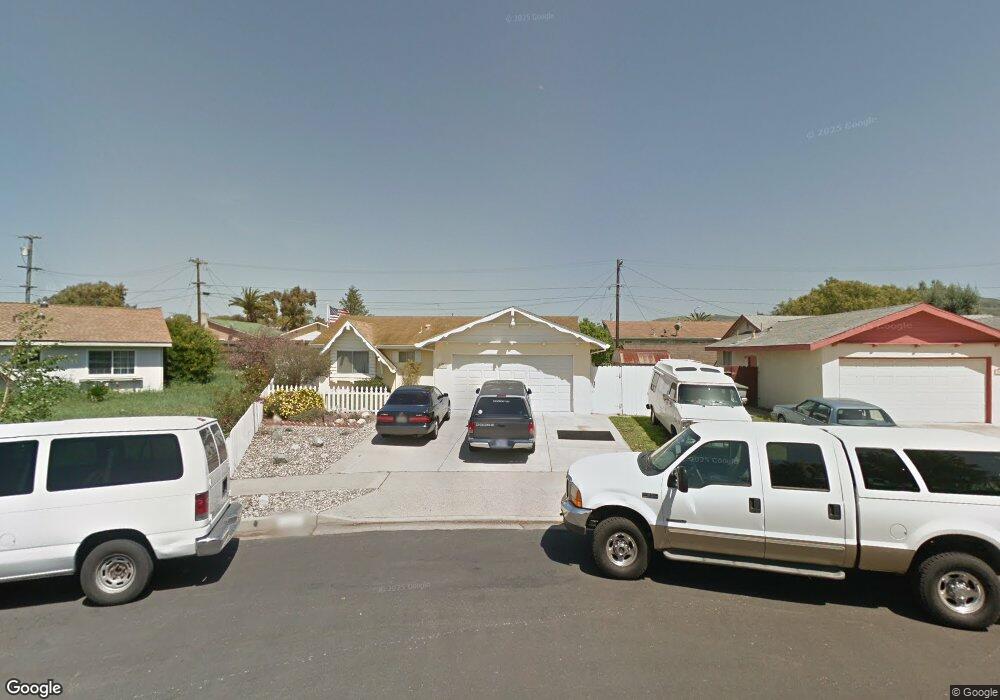
304 S P St Lompoc, CA 93436
Estimated Value: $481,000 - $528,857
3
Beds
2
Baths
1,182
Sq Ft
$435/Sq Ft
Est. Value
About This Home
This home is located at 304 S P St, Lompoc, CA 93436 and is currently estimated at $514,464, approximately $435 per square foot. 304 S P St is a home located in Santa Barbara County with nearby schools including Miguelito Elementary School, Lompoc Valley Middle School, and Lompoc High School.
Ownership History
Date
Name
Owned For
Owner Type
Purchase Details
Closed on
Apr 10, 2024
Sold by
Elizabeth Weir Revocable Trust and Weir Elizabeth
Bought by
Cobb Robert and Cobb Sheila
Current Estimated Value
Home Financials for this Owner
Home Financials are based on the most recent Mortgage that was taken out on this home.
Original Mortgage
$193,250
Outstanding Balance
$190,313
Interest Rate
6.79%
Mortgage Type
New Conventional
Estimated Equity
$324,151
Purchase Details
Closed on
Sep 14, 2023
Sold by
Weir Elizabeth
Bought by
Elizabeth Weir Revocable Trust and Weir
Purchase Details
Closed on
Nov 20, 2019
Sold by
Vargas Adolfo and Estate Of Adolfo Vargas Sr
Bought by
Weir Elizabeth
Home Financials for this Owner
Home Financials are based on the most recent Mortgage that was taken out on this home.
Original Mortgage
$230,400
Interest Rate
3.7%
Mortgage Type
New Conventional
Create a Home Valuation Report for This Property
The Home Valuation Report is an in-depth analysis detailing your home's value as well as a comparison with similar homes in the area
Home Values in the Area
Average Home Value in this Area
Purchase History
| Date | Buyer | Sale Price | Title Company |
|---|---|---|---|
| Cobb Robert | $475,000 | First American Title | |
| Elizabeth Weir Revocable Trust | -- | None Listed On Document | |
| Weir Elizabeth | $288,000 | First American Title Company |
Source: Public Records
Mortgage History
| Date | Status | Borrower | Loan Amount |
|---|---|---|---|
| Open | Cobb Robert | $193,250 | |
| Previous Owner | Weir Elizabeth | $230,400 |
Source: Public Records
Tax History
| Year | Tax Paid | Tax Assessment Tax Assessment Total Assessment is a certain percentage of the fair market value that is determined by local assessors to be the total taxable value of land and additions on the property. | Land | Improvement |
|---|---|---|---|---|
| 2025 | $3,706 | $484,500 | $173,400 | $311,100 |
| 2023 | $3,706 | $325,862 | $115,628 | $210,234 |
| 2022 | $3,642 | $319,473 | $113,361 | $206,112 |
| 2021 | $3,682 | $313,210 | $111,139 | $202,071 |
| 2020 | $3,643 | $310,000 | $110,000 | $200,000 |
| 2019 | $574 | $52,484 | $13,436 | $39,048 |
| 2018 | $563 | $51,456 | $13,173 | $38,283 |
| 2017 | $551 | $50,448 | $12,915 | $37,533 |
| 2016 | $539 | $49,460 | $12,662 | $36,798 |
| 2014 | $525 | $47,764 | $12,228 | $35,536 |
Source: Public Records
Map
Nearby Homes
Your Personal Tour Guide
Ask me questions while you tour the home.