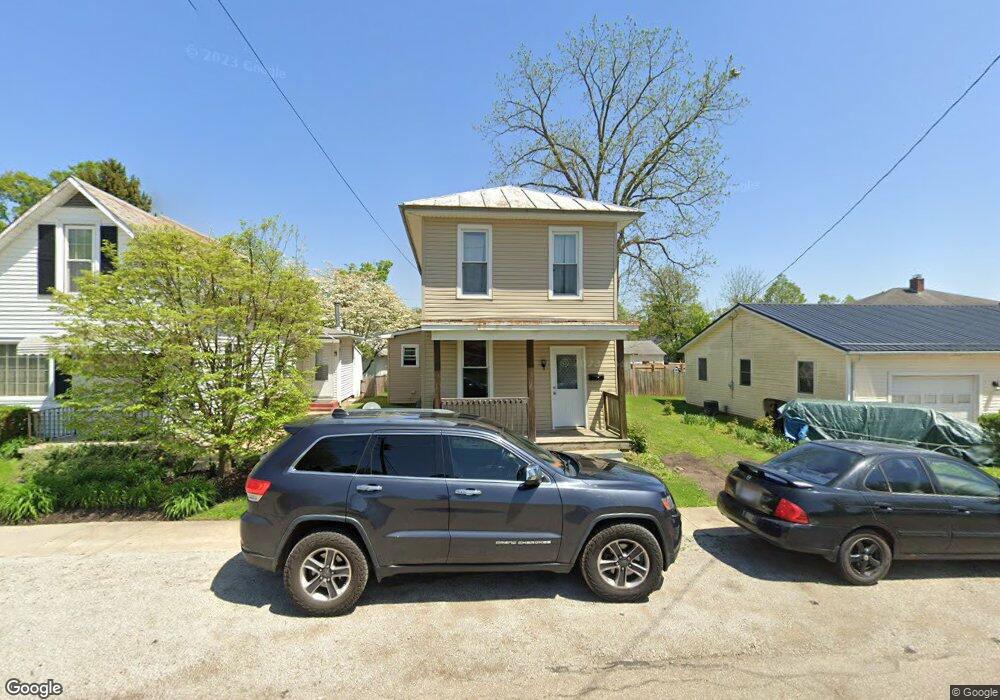
304 S Rogers St Mount Vernon, OH 43050
Estimated Value: $154,759 - $188,000
3
Beds
1
Bath
1,140
Sq Ft
$154/Sq Ft
Est. Value
About This Home
This home is located at 304 S Rogers St, Mount Vernon, OH 43050 and is currently estimated at $175,940, approximately $154 per square foot. 304 S Rogers St is a home located in Knox County with nearby schools including Mount Vernon High School, St. Vincent de Paul School, and Christian Star Academy.
Ownership History
Date
Name
Owned For
Owner Type
Purchase Details
Closed on
Sep 4, 2025
Sold by
Pmp Rentals Llc
Bought by
Crichlow Olivia
Current Estimated Value
Home Financials for this Owner
Home Financials are based on the most recent Mortgage that was taken out on this home.
Original Mortgage
$135,315
Outstanding Balance
$135,315
Interest Rate
6.74%
Mortgage Type
New Conventional
Estimated Equity
$40,625
Purchase Details
Closed on
Sep 7, 2001
Sold by
Humes Myrtle D
Bought by
Tindall Leanne Savage Tte Of Myrtle D Do
Purchase Details
Closed on
Jun 19, 2000
Sold by
Doubikin Myrtle D
Bought by
Mcqueen Linda Lee Humes
Purchase Details
Closed on
Oct 6, 1998
Sold by
Doubikin Tellis and Doubikin Myrtle
Bought by
Doubikin Myrtle D
Purchase Details
Closed on
Jan 4, 1994
Sold by
Mechling Gary F
Bought by
Doubikin Tellis and Doubikin Myrtle
Create a Home Valuation Report for This Property
The Home Valuation Report is an in-depth analysis detailing your home's value as well as a comparison with similar homes in the area
Home Values in the Area
Average Home Value in this Area
Purchase History
| Date | Buyer | Sale Price | Title Company |
|---|---|---|---|
| Crichlow Olivia | $139,500 | None Listed On Document | |
| Crichlow Olivia | $139,500 | None Listed On Document | |
| Tindall Leanne Savage Tte Of Myrtle D Do | -- | -- | |
| Mcqueen Linda Lee Humes | -- | -- | |
| Doubikin Myrtle D | -- | -- | |
| Doubikin Tellis | $24,000 | -- |
Source: Public Records
Mortgage History
| Date | Status | Borrower | Loan Amount |
|---|---|---|---|
| Open | Crichlow Olivia | $135,315 | |
| Closed | Crichlow Olivia | $135,315 |
Source: Public Records
Tax History Compared to Growth
Tax History
| Year | Tax Paid | Tax Assessment Tax Assessment Total Assessment is a certain percentage of the fair market value that is determined by local assessors to be the total taxable value of land and additions on the property. | Land | Improvement |
|---|---|---|---|---|
| 2024 | $1,240 | $31,380 | $3,790 | $27,590 |
| 2023 | $1,218 | $31,380 | $3,790 | $27,590 |
| 2022 | $1,093 | $25,100 | $3,030 | $22,070 |
| 2021 | $1,093 | $25,100 | $3,030 | $22,070 |
| 2020 | $1,065 | $25,100 | $3,030 | $22,070 |
| 2019 | $891 | $19,570 | $4,100 | $15,470 |
| 2018 | $893 | $19,570 | $4,100 | $15,470 |
| 2017 | $879 | $19,570 | $4,100 | $15,470 |
| 2016 | $815 | $18,110 | $3,790 | $14,320 |
| 2015 | $819 | $18,110 | $3,790 | $14,320 |
| 2014 | $823 | $18,110 | $3,790 | $14,320 |
| 2013 | $828 | $16,450 | $3,940 | $12,510 |
Source: Public Records
Map
Nearby Homes
- 302 S Rogers St
- 300 S Rogers St
- 801 E Gambier St
- 707 E Gambier St
- 305 S Center St
- 303 S Center St
- 803 E Gambier St
- 805 E Gambier St
- 301 S Center St
- 303 S Rogers St
- 206 S Rogers St
- 301 S Rogers St
- 705 E Gambier St
- 207 S Rogers St
- 207 S Rogers St
- 207 S Center St
- 01 Liberty Chapel
- 800 E Gambier St
- 204 S Rogers St
- 807 E Gambier St