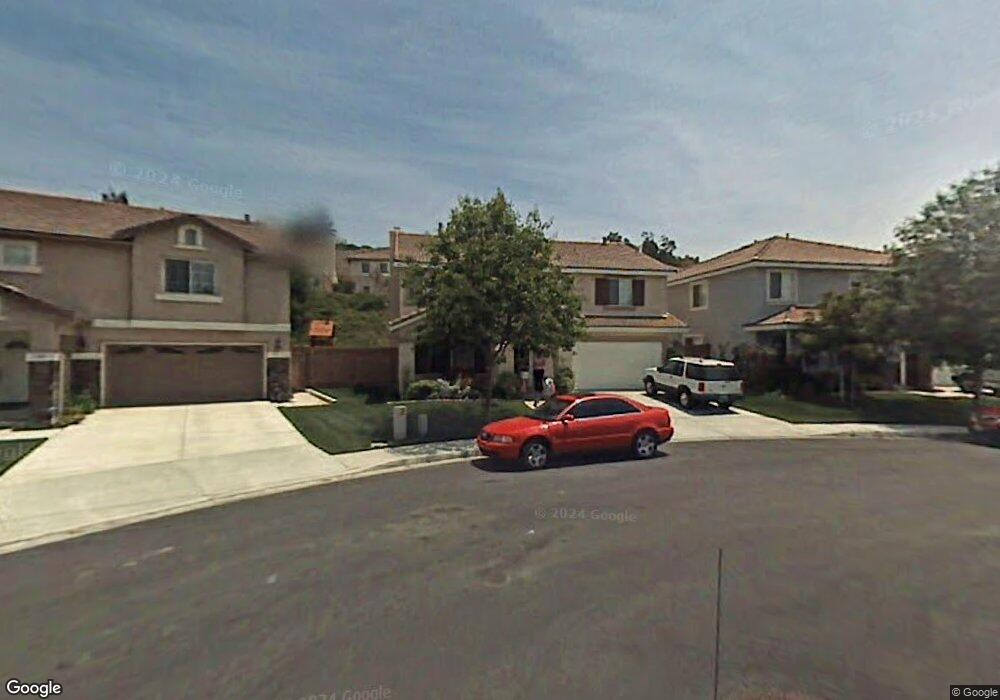
304 Santa Ines Way Oceanside, CA 92057
San Luis Rey NeighborhoodEstimated Value: $994,548 - $1,161,000
3
Beds
3
Baths
2,483
Sq Ft
$441/Sq Ft
Est. Value
About This Home
This home is located at 304 Santa Ines Way, Oceanside, CA 92057 and is currently estimated at $1,093,887, approximately $440 per square foot. 304 Santa Ines Way is a home located in San Diego County with nearby schools including Nichols Elementary School, Martin Luther King Jr. Middle School, and El Camino High School.
Ownership History
Date
Name
Owned For
Owner Type
Purchase Details
Closed on
May 27, 2021
Sold by
Spair Kelly J
Bought by
Spair Kelly J and The Spair Family Trust
Current Estimated Value
Purchase Details
Closed on
Feb 25, 2015
Sold by
Spair Joseph
Bought by
Spair Joseph and Spair Kelly
Home Financials for this Owner
Home Financials are based on the most recent Mortgage that was taken out on this home.
Original Mortgage
$462,300
Outstanding Balance
$352,632
Interest Rate
3.57%
Mortgage Type
VA
Estimated Equity
$741,255
Purchase Details
Closed on
Jan 29, 2014
Sold by
Spair Joseph
Bought by
Spair Joseph and Spair Kelly
Home Financials for this Owner
Home Financials are based on the most recent Mortgage that was taken out on this home.
Original Mortgage
$468,000
Interest Rate
4.46%
Mortgage Type
VA
Purchase Details
Closed on
Jul 18, 2001
Sold by
Genstar Southwest Oasis Llc
Bought by
Fieldstone Communities Inc
Create a Home Valuation Report for This Property
The Home Valuation Report is an in-depth analysis detailing your home's value as well as a comparison with similar homes in the area
Home Values in the Area
Average Home Value in this Area
Purchase History
| Date | Buyer | Sale Price | Title Company |
|---|---|---|---|
| Spair Kelly J | -- | None Available | |
| Spair Joseph | -- | Accommodation | |
| Spair Joseph | -- | Equity Title Company | |
| Spair Joseph | -- | Equity Title Company | |
| Spair Joseph | -- | Equity Title Company | |
| Fieldstone Communities Inc | -- | First American Title |
Source: Public Records
Mortgage History
| Date | Status | Borrower | Loan Amount |
|---|---|---|---|
| Open | Spair Joseph | $462,300 | |
| Closed | Spair Joseph | $468,000 | |
| Closed | Fieldstone Communities Inc | $0 |
Source: Public Records
Tax History Compared to Growth
Tax History
| Year | Tax Paid | Tax Assessment Tax Assessment Total Assessment is a certain percentage of the fair market value that is determined by local assessors to be the total taxable value of land and additions on the property. | Land | Improvement |
|---|---|---|---|---|
| 2025 | $3,103 | $452,745 | $208,175 | $244,570 |
| 2024 | $3,103 | $443,869 | $204,094 | $239,775 |
| 2023 | $3,067 | $435,167 | $200,093 | $235,074 |
| 2022 | $3,108 | $426,635 | $196,170 | $230,465 |
| 2021 | $3,115 | $418,271 | $192,324 | $225,947 |
| 2020 | $3,050 | $413,983 | $190,352 | $223,631 |
| 2019 | $3,191 | $405,867 | $186,620 | $219,247 |
| 2018 | $4,384 | $397,910 | $182,961 | $214,949 |
| 2017 | $71 | $390,109 | $179,374 | $210,735 |
| 2016 | $4,161 | $382,460 | $175,857 | $206,603 |
| 2015 | $4,039 | $376,716 | $173,216 | $203,500 |
| 2014 | $3,881 | $369,337 | $169,823 | $199,514 |
Source: Public Records
Map
Nearby Homes
- 343 La Purisma Way
- 339 La Purisma Way
- 367 La Purisma Way
- 314 La Soledad Way
- 1185 Masterpiece Dr
- 4430 Avenida Del Gado
- 317 Pennyroyal Way
- 4783 Mayflower Way
- 4485 Kittiwake Way
- 206 Avenida Las Brisas
- 972 Surfbird Way
- 942 Royal Tern Way
- 4727 Mayflower Way
- 4418 Chickadee Way
- 4414 Chickadee Way
- 1014 Plover Way
- 247 Currant Way
- 4402 Chickadee Way
- 4408 Shearwater Way
- 4396 Albatross Way
- 308 Santa Ines Way
- 300 Santa Ines Way
- 333 La Soledad Way
- 312 Santa Ines Way
- 337 La Soledad Way
- 329 La Soledad Way
- 341 La Soledad Way
- 315 La Purisma Way
- 311 La Purisma Way
- 325 La Soledad Way
- 316 Santa Ines Way
- 307 La Purisma Way
- 319 La Purisma Way
- 345 La Soledad Way
- 321 La Soledad Way
- 323 La Purisma Way
- 320 Santa Ines Way
- 349 La Soledad Way
- 317 La Soledad Way
- 303 La Purisma Way