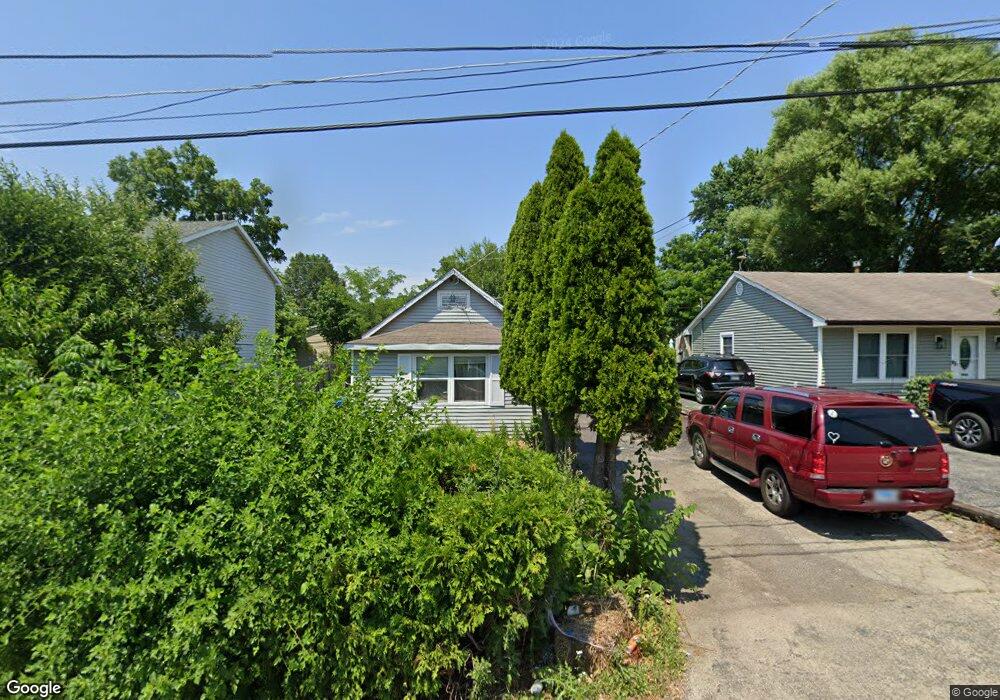
304 Shadydell Ave Mundelein, IL 60060
Estimated Value: $139,000 - $257,000
3
Beds
1
Bath
942
Sq Ft
$222/Sq Ft
Est. Value
About This Home
This home is located at 304 Shadydell Ave, Mundelein, IL 60060 and is currently estimated at $208,970, approximately $221 per square foot. 304 Shadydell Ave is a home located in Lake County with nearby schools including Diamond Lake Elementary School, West Oak Middle School, and Mundelein Cons High School.
Ownership History
Date
Name
Owned For
Owner Type
Purchase Details
Closed on
Jul 17, 2012
Sold by
Bank Of New York Mellon
Bought by
Alien Remise
Current Estimated Value
Purchase Details
Closed on
Jan 6, 2012
Sold by
Garcia Jose and Garcia Maria
Bought by
The Bank Of New York Mellon
Purchase Details
Closed on
Sep 15, 2004
Sold by
Garcia Jose and Garcia Maria
Bought by
Garcia Jose and Garcia Maria
Home Financials for this Owner
Home Financials are based on the most recent Mortgage that was taken out on this home.
Original Mortgage
$132,000
Interest Rate
7.62%
Mortgage Type
New Conventional
Purchase Details
Closed on
Dec 14, 2000
Sold by
Garcia Jose and Guzman Evaristo
Bought by
Garcia Jose and Garcia Maria
Purchase Details
Closed on
Aug 8, 1996
Sold by
Venegas Salvadore
Bought by
Garcia Jose and Guzman Evaristo
Home Financials for this Owner
Home Financials are based on the most recent Mortgage that was taken out on this home.
Original Mortgage
$89,622
Interest Rate
8.18%
Mortgage Type
FHA
Create a Home Valuation Report for This Property
The Home Valuation Report is an in-depth analysis detailing your home's value as well as a comparison with similar homes in the area
Home Values in the Area
Average Home Value in this Area
Purchase History
| Date | Buyer | Sale Price | Title Company |
|---|---|---|---|
| Alien Remise | $16,500 | First American Title | |
| The Bank Of New York Mellon | $170,927 | None Available | |
| Garcia Jose | -- | -- | |
| Garcia Jose | -- | Law Title Insurance Co Inc | |
| Garcia Jose | $90,000 | -- |
Source: Public Records
Mortgage History
| Date | Status | Borrower | Loan Amount |
|---|---|---|---|
| Previous Owner | Garcia Jose | $132,000 | |
| Previous Owner | Garcia Jose | $89,622 |
Source: Public Records
Tax History Compared to Growth
Tax History
| Year | Tax Paid | Tax Assessment Tax Assessment Total Assessment is a certain percentage of the fair market value that is determined by local assessors to be the total taxable value of land and additions on the property. | Land | Improvement |
|---|---|---|---|---|
| 2024 | $3,287 | $35,294 | $12,598 | $22,696 |
| 2023 | $2,975 | $31,003 | $11,067 | $19,936 |
| 2022 | $2,975 | $27,865 | $10,636 | $17,229 |
| 2021 | $2,871 | $27,265 | $10,407 | $16,858 |
| 2020 | $2,575 | $24,370 | $9,302 | $15,068 |
| 2019 | $2,307 | $21,944 | $8,376 | $13,568 |
| 2018 | $1,933 | $18,452 | $5,385 | $13,067 |
| 2017 | $1,909 | $17,869 | $5,215 | $12,654 |
| 2016 | $1,849 | $16,943 | $4,945 | $11,998 |
| 2015 | $1,801 | $15,836 | $4,622 | $11,214 |
| 2014 | $1,495 | $13,700 | $4,559 | $9,141 |
| 2012 | $1,775 | $22,514 | $6,571 | $15,943 |
Source: Public Records
Map
Nearby Homes
- 130 Shadydell Ave
- 342 Allanson Rd
- 207 Shady Ln
- 18804 W Hickory St
- 18838 W Hickory St
- 519 Jennifer Cir Unit 111
- 1651 Pauline Cir Unit 1
- 1631 Pauline Cir Unit 3
- 18951 W Hickory St
- 433 E High St
- 640 Allanson Rd
- 1544 Lakeridge Ct
- 510 S Hickory St
- 114 W Hawthorne Blvd
- 228 Woodlawn Dr
- 19330 W Lake View Ave
- 26346 N Walnut Ave
- 26325 N Walnut Ave
- 18 S Hawthorne Blvd
- 26980 N Pierre Dr
- 228 Shadydell Ave
- 308 Shadydell Ave
- 312 Shadydell Ave
- 224 Shadydell Ave
- 247 Longwood Terrace
- 241 Longwood Terrace
- 305 Shadydell Ave
- 233 Longwood Terrace
- 309 Shadydell Ave
- 313 Shadydell Ave
- 220 Shadydell Ave
- 225 Shadydell Ave
- 318 Shadydell Ave
- 227 Longwood Terrace
- 229 Shadydell Ave
- 317 Longwood Terrace
- 0 Longwood Terrace
- 319 Shadydell Ave
- 221 Shadydell Ave
- 216 Shadydell Ave