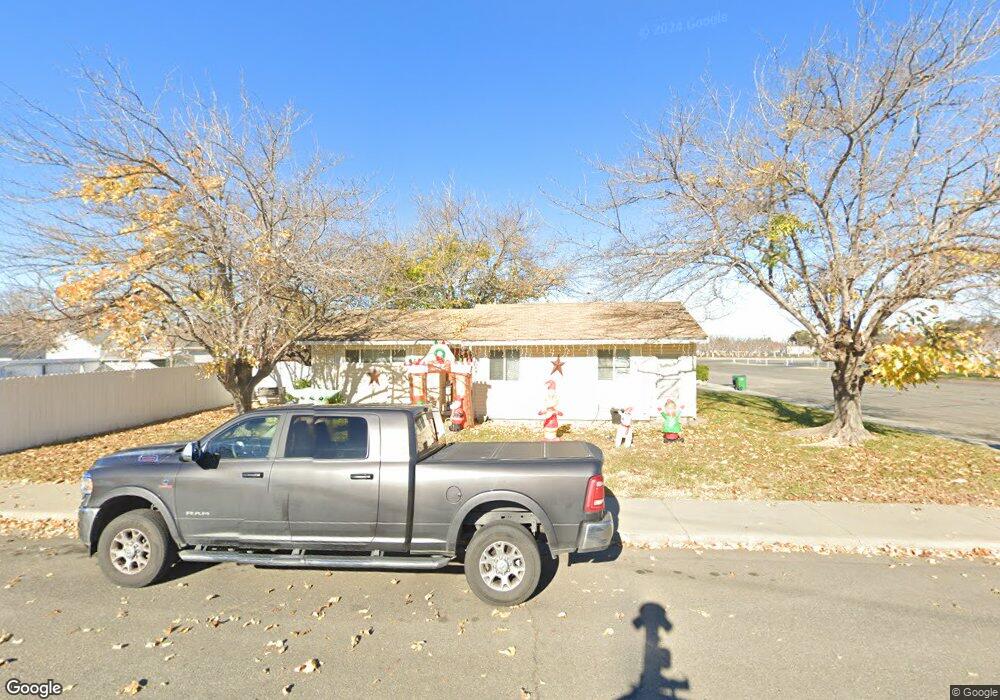
304 Suisun St Orland, CA 95963
Estimated Value: $246,000 - $333,000
2
Beds
2
Baths
1,017
Sq Ft
$279/Sq Ft
Est. Value
About This Home
This home is located at 304 Suisun St, Orland, CA 95963 and is currently estimated at $283,249, approximately $278 per square foot. 304 Suisun St is a home located in Glenn County with nearby schools including Mill Street Elementary School, Fairview Elementary School, and Price Intermediate School.
Ownership History
Date
Name
Owned For
Owner Type
Purchase Details
Closed on
Apr 13, 2005
Sold by
Fleharty Cindy
Bought by
Fleharty Scott
Current Estimated Value
Home Financials for this Owner
Home Financials are based on the most recent Mortgage that was taken out on this home.
Original Mortgage
$166,250
Outstanding Balance
$92,423
Interest Rate
6.99%
Mortgage Type
Fannie Mae Freddie Mac
Estimated Equity
$190,826
Create a Home Valuation Report for This Property
The Home Valuation Report is an in-depth analysis detailing your home's value as well as a comparison with similar homes in the area
Home Values in the Area
Average Home Value in this Area
Purchase History
| Date | Buyer | Sale Price | Title Company |
|---|---|---|---|
| Fleharty Scott | -- | North State Title Co | |
| Fleharty Scott | $175,000 | North State Title Co |
Source: Public Records
Mortgage History
| Date | Status | Borrower | Loan Amount |
|---|---|---|---|
| Open | Fleharty Scott | $166,250 |
Source: Public Records
Tax History Compared to Growth
Tax History
| Year | Tax Paid | Tax Assessment Tax Assessment Total Assessment is a certain percentage of the fair market value that is determined by local assessors to be the total taxable value of land and additions on the property. | Land | Improvement |
|---|---|---|---|---|
| 2025 | $2,051 | $243,947 | $69,699 | $174,248 |
| 2024 | $2,051 | $182,389 | $66,000 | $116,389 |
| 2023 | $1,711 | $151,991 | $55,000 | $96,991 |
| 2022 | $1,562 | $138,174 | $52,000 | $86,174 |
| 2021 | $1,448 | $125,613 | $47,105 | $78,508 |
| 2020 | $1,335 | $114,194 | $42,823 | $71,371 |
| 2019 | $1,234 | $103,813 | $38,930 | $64,883 |
| 2018 | $1,104 | $97,020 | $36,382 | $60,638 |
| 2017 | $1,114 | $92,400 | $34,650 | $57,750 |
| 2016 | $1,067 | $92,400 | $34,650 | $57,750 |
| 2015 | $1,019 | $88,000 | $33,000 | $55,000 |
| 2014 | $973 | $83,790 | $31,500 | $52,290 |
Source: Public Records
Map
Nearby Homes