304 W Randolph St Anthon, IA 51004
Estimated Value: $33,190 - $115,000
2
Beds
1
Bath
750
Sq Ft
$113/Sq Ft
Est. Value
About This Home
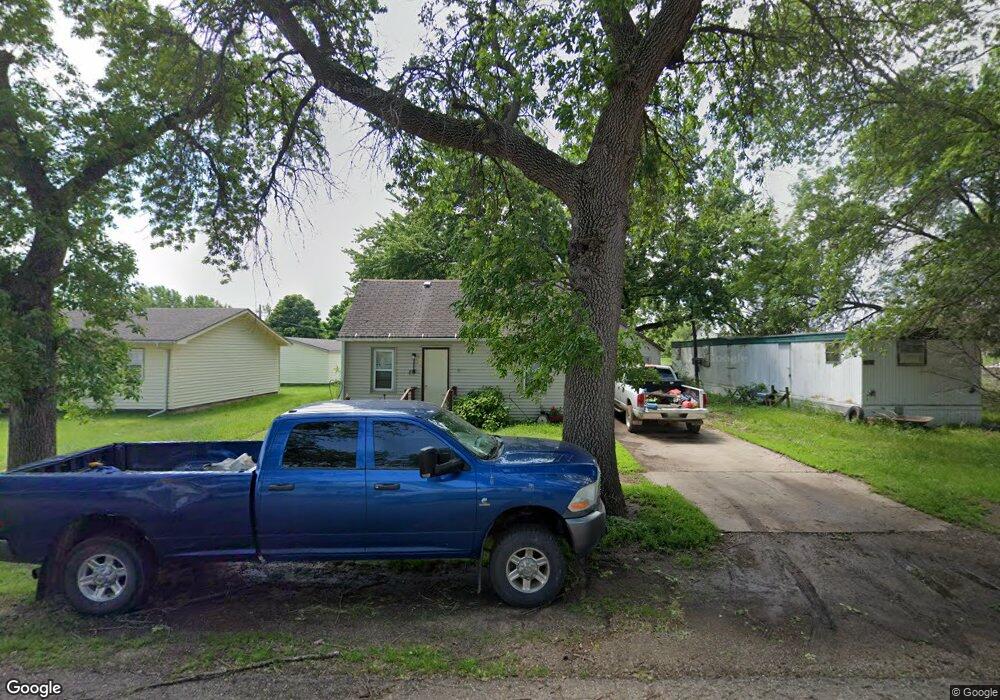
This home is located at 304 W Randolph St, Anthon, IA 51004 and is currently estimated at $84,548, approximately $112 per square foot. 304 W Randolph St is a home located in Woodbury County with nearby schools including Anthon Elementary School, Mvao Middle School, and Maple Valley-Anthon Oto High School.
Ownership History
Date
Name
Owned For
Owner Type
Purchase Details
Closed on
Apr 29, 2024
Sold by
Handke Craig and Handke Lori
Bought by
Hoy Wilbur Judd
Current Estimated Value
Home Financials for this Owner
Home Financials are based on the most recent Mortgage that was taken out on this home.
Original Mortgage
$20,800
Outstanding Balance
$18,645
Interest Rate
6.87%
Mortgage Type
New Conventional
Estimated Equity
$65,903
Purchase Details
Closed on
Nov 13, 2017
Sold by
Dowing Jervae
Bought by
Handke Craig and Handke Lori
Create a Home Valuation Report for This Property
The Home Valuation Report is an in-depth analysis detailing your home's value as well as a comparison with similar homes in the area
Home Values in the Area
Average Home Value in this Area
Purchase History
| Date | Buyer | Sale Price | Title Company |
|---|---|---|---|
| Hoy Wilbur Judd | $26,000 | None Listed On Document | |
| Handke Craig | $8,500 | None Available |
Source: Public Records
Mortgage History
| Date | Status | Borrower | Loan Amount |
|---|---|---|---|
| Open | Hoy Wilbur Judd | $20,800 |
Source: Public Records
Tax History Compared to Growth
Tax History
| Year | Tax Paid | Tax Assessment Tax Assessment Total Assessment is a certain percentage of the fair market value that is determined by local assessors to be the total taxable value of land and additions on the property. | Land | Improvement |
|---|---|---|---|---|
| 2025 | $342 | $30,220 | $5,360 | $24,860 |
| 2024 | $342 | $24,340 | $5,360 | $18,980 |
| 2023 | $322 | $24,340 | $5,360 | $18,980 |
| 2022 | $314 | $18,980 | $5,360 | $13,620 |
| 2021 | $314 | $18,980 | $5,360 | $13,620 |
| 2020 | $342 | $19,820 | $5,740 | $14,080 |
| 2019 | $356 | $19,820 | $5,740 | $14,080 |
| 2018 | $262 | $19,820 | $5,740 | $14,080 |
| 2017 | $262 | $23,490 | $5,740 | $17,750 |
| 2016 | $0 | $23,490 | $0 | $0 |
| 2015 | $369 | $21,950 | $5,360 | $16,590 |
| 2014 | $364 | $20,760 | $5,360 | $15,400 |
Source: Public Records
Map
Nearby Homes
- 302 W Randolph St
- 306 E Randolph St
- 208 W Randolph St
- 307 W Randolph St
- 101 Westgate Rd
- 305 W Randolph St
- 301 W Randolph St
- 103 Westgate Rd
- 400 W Main St
- 100 Westgate Rd
- 301 S Fox Ave
- 109 Highway 31
- 109 Highway 31
- 300 W Main St
- 306 W Main St
- 307 Highway 31
- 105 Westgate Rd
- 208 W Main St
- 102 Westgate Rd
- 206 W Main St