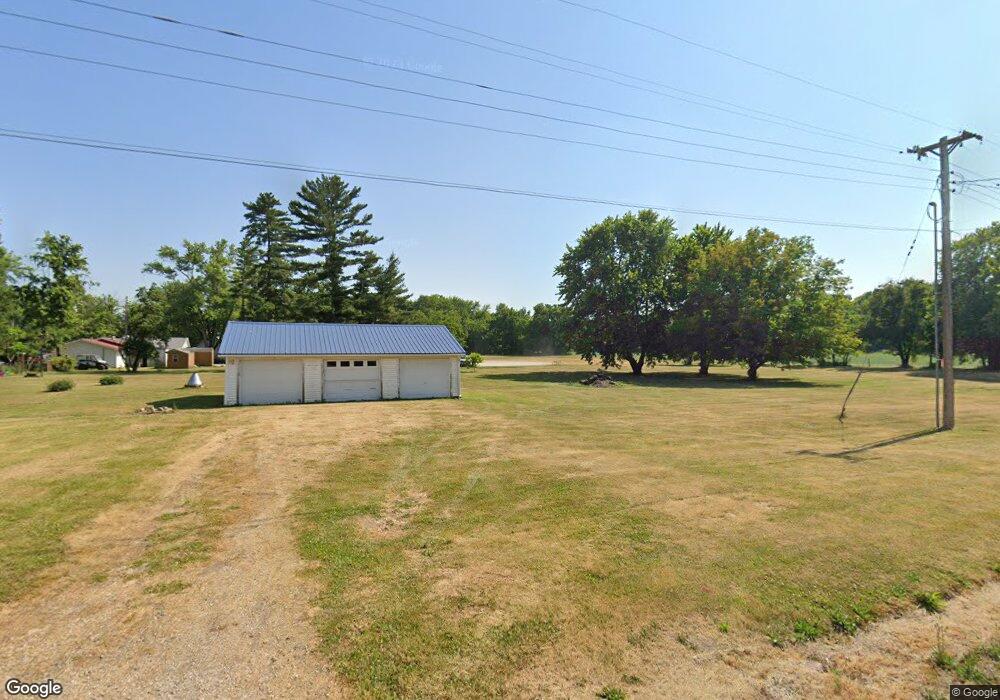
304 W Union St West Union, IL 62477
Estimated Value: $62,000 - $93,549
--
Bed
--
Bath
1,910
Sq Ft
$42/Sq Ft
Est. Value
About This Home
This home is located at 304 W Union St, West Union, IL 62477 and is currently estimated at $80,137, approximately $41 per square foot. 304 W Union St is a home located in Clark County with nearby schools including South Elementary School, North Elementary School, and Marshall Junior High School.
Ownership History
Date
Name
Owned For
Owner Type
Purchase Details
Closed on
Sep 2, 2016
Sold by
Chapman Stephanie
Bought by
Chapman Victoria
Current Estimated Value
Purchase Details
Closed on
May 13, 2016
Sold by
Chapman Victoria L and Smith Jessica R
Bought by
Chapman Stephanie M
Purchase Details
Closed on
Jun 27, 2007
Sold by
Chapman Kimberly Diane
Bought by
Chapman David Loren
Create a Home Valuation Report for This Property
The Home Valuation Report is an in-depth analysis detailing your home's value as well as a comparison with similar homes in the area
Home Values in the Area
Average Home Value in this Area
Purchase History
| Date | Buyer | Sale Price | Title Company |
|---|---|---|---|
| Chapman Victoria | -- | None Available | |
| Chapman Stephanie M | -- | Attorney | |
| Chapman David Loren | -- | None Available |
Source: Public Records
Tax History Compared to Growth
Tax History
| Year | Tax Paid | Tax Assessment Tax Assessment Total Assessment is a certain percentage of the fair market value that is determined by local assessors to be the total taxable value of land and additions on the property. | Land | Improvement |
|---|---|---|---|---|
| 2024 | $245 | $3,461 | $2,386 | $1,075 |
| 2023 | $242 | $3,461 | $2,386 | $1,075 |
| 2022 | $223 | $3,090 | $2,130 | $960 |
| 2021 | $414 | $5,287 | $4,260 | $1,027 |
| 2020 | $419 | $5,154 | $4,260 | $894 |
| 2019 | $419 | $5,154 | $4,260 | $894 |
| 2018 | $1,176 | $14,000 | $2,070 | $11,930 |
| 2017 | $1,198 | $14,318 | $2,117 | $12,201 |
| 2016 | $1,267 | $14,000 | $2,070 | $11,930 |
| 2015 | $779 | $14,728 | $2,055 | $12,673 |
| 2014 | $781 | $14,335 | $2,000 | $12,335 |
| 2013 | $781 | $14,335 | $2,000 | $12,335 |
Source: Public Records
Map
Nearby Homes
- E 450th Rd Lot Unit WP001
- E 2025th Ave
- 20392 N Lake Walton Rd
- 20301 County Road 920 N
- 0 N River Rd
- 407 N Main St
- 100 N 2nd St
- 301 S Pleasant St
- 600 S Pleasant St
- 208 Wood Ln
- 6823 W Gobin Dr
- 14752 S Battlerow Place
- 14709 S Battlerow Place
- 7157 E 2000th Ave
- 2001-2615 N 900th St
- 6198 W French Dr
- 14298 N 1650th St
- 0 County Road 300 N
- 104 Thomas Dr
- 0 N 925th St
- 105 S State Highway 1
- 313 W Union St
- 210 W Union St
- 115 S State Highway 1
- 125 Po Box
- 203 N State Highway 1
- 203 N State Highway 1
- 203 S State Highway 1
- 109 S Walnut St
- 18769 E Angling Rd
- 309 S State Highway 1
- 111 N Walnut St
- 211 S Walnut St
- 220 N State Highway 1
- 106 E Union St
- 114 N Walnut St
- 317 S State Highway 1
- 317 S State Highway 1
- 326 W Union St
- 108 N Walnut St