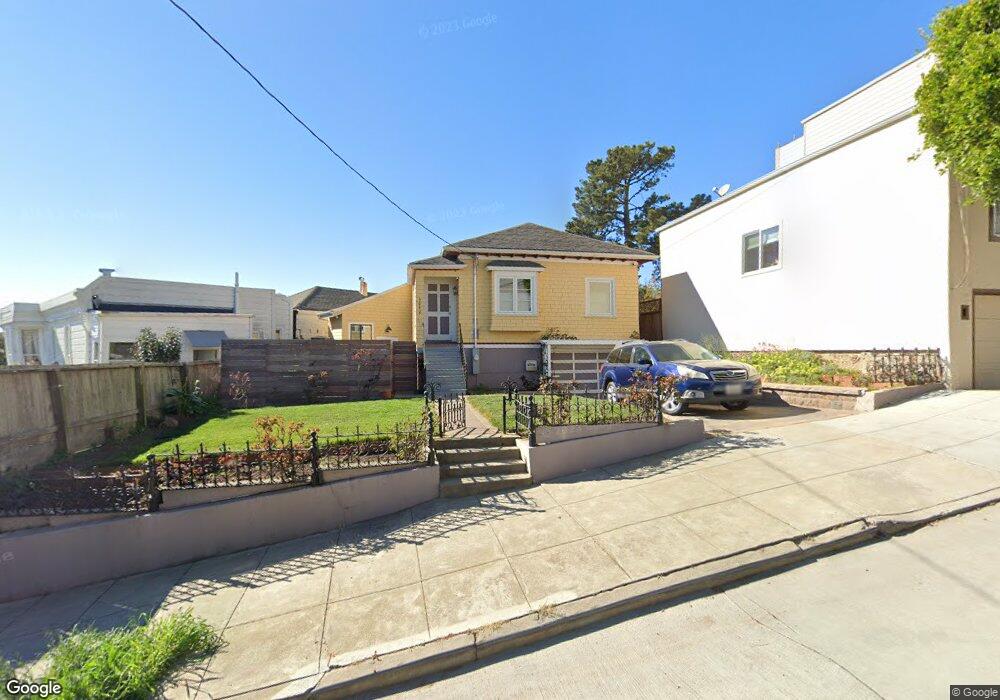
3040 Castro St San Francisco, CA 94131
Glen Park NeighborhoodEstimated Value: $1,039,000 - $1,518,908
2
Beds
1
Bath
865
Sq Ft
$1,543/Sq Ft
Est. Value
About This Home
This home is located at 3040 Castro St, San Francisco, CA 94131 and is currently estimated at $1,334,977, approximately $1,543 per square foot. 3040 Castro St is a home located in San Francisco County with nearby schools including Glen Park Elementary School, James Lick Middle School, and St John Catholic School.
Ownership History
Date
Name
Owned For
Owner Type
Purchase Details
Closed on
Jan 12, 2022
Sold by
Michal Eric S and Michal Sara E
Bought by
Michal Eric S and Michal Sara E
Current Estimated Value
Home Financials for this Owner
Home Financials are based on the most recent Mortgage that was taken out on this home.
Original Mortgage
$1,085,000
Outstanding Balance
$1,001,394
Interest Rate
3.22%
Mortgage Type
New Conventional
Estimated Equity
$333,583
Purchase Details
Closed on
Jul 2, 2019
Sold by
Marder Jennifer Rachel and Arthur M Bree 2012 Trust
Bought by
Michal Eric S and Moynihan Sara E
Home Financials for this Owner
Home Financials are based on the most recent Mortgage that was taken out on this home.
Original Mortgage
$1,072,000
Interest Rate
3.9%
Mortgage Type
New Conventional
Purchase Details
Closed on
Jan 12, 2012
Sold by
Bree Arthur M
Bought by
Bree Arthur M and The Arthur M Bree 2012 Trust
Create a Home Valuation Report for This Property
The Home Valuation Report is an in-depth analysis detailing your home's value as well as a comparison with similar homes in the area
Home Values in the Area
Average Home Value in this Area
Purchase History
| Date | Buyer | Sale Price | Title Company |
|---|---|---|---|
| Michal Eric S | -- | Servicelink | |
| Michal Eric S | $1,340,000 | Chicago Title Company | |
| Bree Arthur M | -- | None Available |
Source: Public Records
Mortgage History
| Date | Status | Borrower | Loan Amount |
|---|---|---|---|
| Open | Michal Eric S | $1,085,000 | |
| Previous Owner | Michal Eric S | $1,072,000 |
Source: Public Records
Tax History Compared to Growth
Tax History
| Year | Tax Paid | Tax Assessment Tax Assessment Total Assessment is a certain percentage of the fair market value that is determined by local assessors to be the total taxable value of land and additions on the property. | Land | Improvement |
|---|---|---|---|---|
| 2025 | $17,620 | $1,465,481 | $1,025,838 | $439,643 |
| 2024 | $17,620 | $1,436,747 | $1,005,724 | $431,023 |
| 2023 | $17,355 | $1,408,576 | $986,004 | $422,572 |
| 2022 | $17,024 | $1,380,956 | $966,670 | $414,286 |
| 2021 | $16,723 | $1,353,880 | $947,716 | $406,164 |
| 2020 | $16,800 | $1,340,000 | $938,000 | $402,000 |
| 2019 | $5,905 | $497,993 | $323,377 | $174,616 |
| 2018 | $5,708 | $488,230 | $317,037 | $171,193 |
| 2017 | $5,640 | $478,658 | $310,821 | $167,837 |
| 2016 | $5,530 | $469,274 | $304,727 | $164,547 |
| 2015 | $5,463 | $462,226 | $300,150 | $162,076 |
| 2014 | $5,318 | $453,173 | $294,271 | $158,902 |
Source: Public Records
Map
Nearby Homes
- 43 Sussex St
- 101 Moffitt St
- 246 Bemis St
- 474 Arlington St Unit 478
- 8 Mateo St
- 360 Laidley St Unit 362
- 101 Farnum St
- 54-56 Monterey Blvd
- 58 Monterey Blvd
- 25 Mizpah St
- 101 Joost Ave
- 200 Cayuga Ave
- 37 Miguel St Unit 6
- 30 Harry St
- 144 Laidley St
- 210 Laidley St
- 176 Laidley St
- 408 Gold Mine Dr
- 35 Admiral Ave
- 266-268 Arlington St