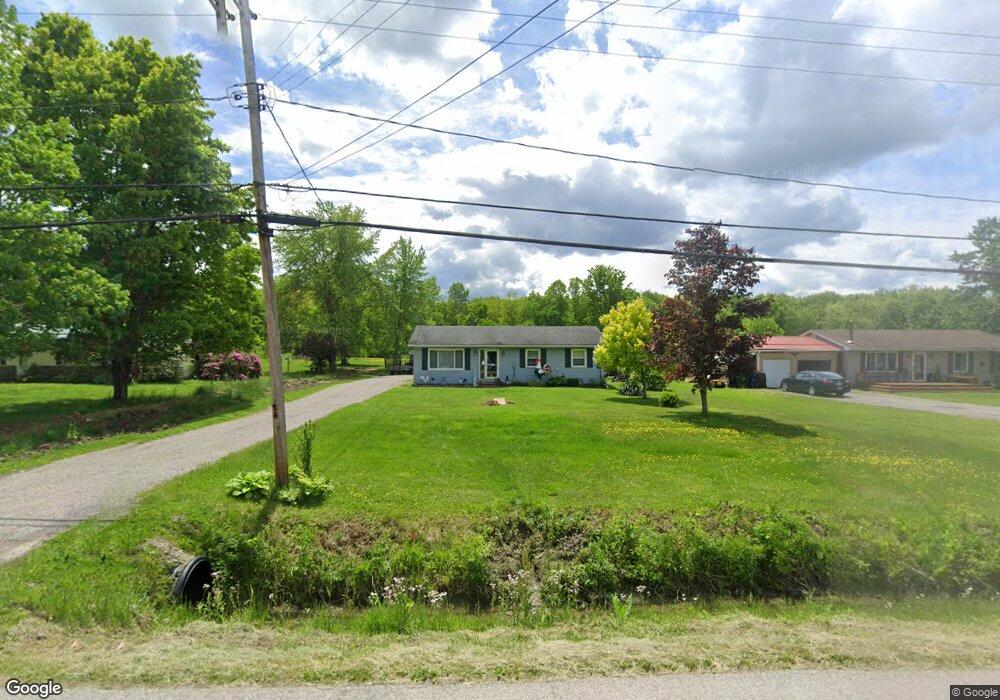
3040 Rome Rock Creek Rd Rock Creek, OH 44084
Estimated Value: $123,778 - $180,000
3
Beds
1
Bath
1,008
Sq Ft
$158/Sq Ft
Est. Value
About This Home
This home is located at 3040 Rome Rock Creek Rd, Rock Creek, OH 44084 and is currently estimated at $159,445, approximately $158 per square foot. 3040 Rome Rock Creek Rd is a home located in Ashtabula County with nearby schools including Rock Creek Elementary School, Jefferson Area Junior High School, and Jefferson Area Senior High School.
Ownership History
Date
Name
Owned For
Owner Type
Purchase Details
Closed on
Nov 30, 2023
Sold by
Powers Hailey R
Bought by
Burns Shawnasee and Burns Laurie
Current Estimated Value
Home Financials for this Owner
Home Financials are based on the most recent Mortgage that was taken out on this home.
Original Mortgage
$100,000
Interest Rate
5.93%
Mortgage Type
Credit Line Revolving
Purchase Details
Closed on
Aug 29, 2022
Sold by
Powers Christopher S
Bought by
Powers Hailey R
Purchase Details
Closed on
Mar 24, 2021
Sold by
Wiencek Peter J and Devandry Deneen D
Bought by
Powers Christopher S and Powers Hailey R
Home Financials for this Owner
Home Financials are based on the most recent Mortgage that was taken out on this home.
Original Mortgage
$84,397
Interest Rate
2.73%
Mortgage Type
VA
Create a Home Valuation Report for This Property
The Home Valuation Report is an in-depth analysis detailing your home's value as well as a comparison with similar homes in the area
Home Values in the Area
Average Home Value in this Area
Purchase History
| Date | Buyer | Sale Price | Title Company |
|---|---|---|---|
| Burns Shawnasee | $150,000 | None Listed On Document | |
| Burns Shawnasee | $150,000 | None Listed On Document | |
| Powers Hailey R | $125 | -- | |
| Powers Christopher S | $84,397 | Title Professionals Group Lt |
Source: Public Records
Mortgage History
| Date | Status | Borrower | Loan Amount |
|---|---|---|---|
| Previous Owner | Burns Shawnasee | $100,000 | |
| Previous Owner | Powers Christopher S | $84,397 |
Source: Public Records
Tax History Compared to Growth
Tax History
| Year | Tax Paid | Tax Assessment Tax Assessment Total Assessment is a certain percentage of the fair market value that is determined by local assessors to be the total taxable value of land and additions on the property. | Land | Improvement |
|---|---|---|---|---|
| 2024 | $2,684 | $31,580 | $8,580 | $23,000 |
| 2023 | $1,442 | $31,580 | $8,580 | $23,000 |
| 2022 | $1,252 | $25,030 | $6,620 | $18,410 |
| 2021 | $1,265 | $25,030 | $6,620 | $18,410 |
| 2020 | $1,244 | $25,030 | $6,620 | $18,410 |
| 2019 | $1,291 | $26,260 | $5,920 | $20,340 |
| 2018 | $1,247 | $26,260 | $5,920 | $20,340 |
| 2017 | $1,252 | $26,260 | $5,920 | $20,340 |
| 2016 | $1,268 | $26,260 | $5,920 | $20,340 |
| 2015 | $1,259 | $26,260 | $5,920 | $20,340 |
| 2014 | $1,219 | $26,260 | $5,920 | $20,340 |
| 2013 | $1,272 | $28,110 | $5,040 | $23,070 |
Source: Public Records
Map
Nearby Homes
- 3196 N Main St
- 2866 Jefferson St
- 3031 Logan Ln Unit 1
- 603 Oriole Dr
- 640 Oriole Dr
- 498 Eagle Point
- 490 Peacock Ln
- 681&682 Rome Rock Creek Rd
- 664 Wren Cir
- 2891 Callender Rd
- 410 Geneva Point
- 3330 Forman Rd
- 2514 Hayford Rd
- 0 Rome Rock Creek Rd Unit 5166696
- 2488 Tupelo Dr
- 322 Morgan Terrace
- 2477 Trellis Place
- 683 Rome Rock Creek Rd
- 371 Rome Rock Creek Rd
- 2498 Hayford Rd
- 3010 Rome Rock Creek Rd
- 3030 Rome Rock Creek Rd
- 3060 Rome Rock Creek Rd
- 3020 Rome Rock Creek Rd
- 3023 Rome Rock Creek Rd
- 3037 Rome Rock Creek Rd
- 3050 Rome Rock Creek Rd
- 3063 Rome Rock Creek Rd
- 3005 Rome Rock Creek Rd
- 3077 Rome Rock Creek Rd
- 3085 Rome Rock Creek Rd
- 3088 Rome Rock Creek Rd
- 3001 Rome Rock Creek Rd
- 2970 Rome Rock Creek Rd
- 2960 Rome Rock Creek Rd
- 3484 S Ridge Rd
- 3506 S Main St
- 2941 Rome Rock Creek Rd
- 0 South St Unit 2439842
- 0 Rome Rock Creek Rd Unit 3764032