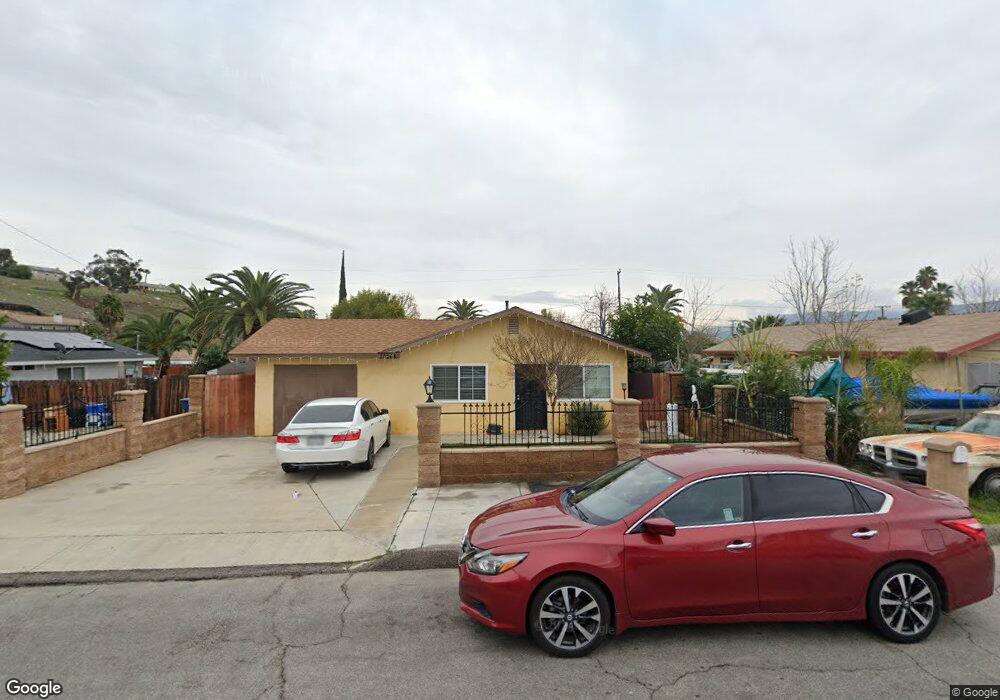
30402 Jernigan St Lake Elsinore, CA 92530
Country Club Heights NeighborhoodEstimated Value: $513,000 - $560,000
4
Beds
2
Baths
1,586
Sq Ft
$341/Sq Ft
Est. Value
About This Home
This home is located at 30402 Jernigan St, Lake Elsinore, CA 92530 and is currently estimated at $540,700, approximately $340 per square foot. 30402 Jernigan St is a home located in Riverside County with nearby schools including Machado Elementary School, Terra Cotta Middle School, and Lakeside High School.
Ownership History
Date
Name
Owned For
Owner Type
Purchase Details
Closed on
Oct 7, 2025
Sold by
Williams Rachelle Annette
Bought by
Rachelle Annette Williams Revocable Living Tr and Williams
Current Estimated Value
Purchase Details
Closed on
May 9, 2018
Sold by
Williams Rachelle A
Bought by
Williams Rachelle A
Purchase Details
Closed on
Jan 17, 2011
Sold by
Wilson Sonja Mary
Bought by
The Sonja M Wilson 2011 Trust
Purchase Details
Closed on
Mar 24, 2000
Sold by
Wilson Sonja Mary Trustee and Wilson Sonja Living
Bought by
Wilson Sonja Mary
Home Financials for this Owner
Home Financials are based on the most recent Mortgage that was taken out on this home.
Original Mortgage
$40,000
Interest Rate
8.38%
Purchase Details
Closed on
Apr 15, 1997
Sold by
Williams Sonja M and Williams Sonja Mary
Bought by
Wilson Sonja Mary and The Sonja Wilson Living Trust
Create a Home Valuation Report for This Property
The Home Valuation Report is an in-depth analysis detailing your home's value as well as a comparison with similar homes in the area
Home Values in the Area
Average Home Value in this Area
Purchase History
| Date | Buyer | Sale Price | Title Company |
|---|---|---|---|
| Rachelle Annette Williams Revocable Living Tr | -- | None Listed On Document | |
| Williams Rachelle A | -- | None Available | |
| The Sonja M Wilson 2011 Trust | -- | None Available | |
| Wilson Sonja Mary | -- | -- | |
| Wilson Sonja Mary | -- | -- |
Source: Public Records
Mortgage History
| Date | Status | Borrower | Loan Amount |
|---|---|---|---|
| Previous Owner | Wilson Sonja Mary | $40,000 |
Source: Public Records
Tax History Compared to Growth
Tax History
| Year | Tax Paid | Tax Assessment Tax Assessment Total Assessment is a certain percentage of the fair market value that is determined by local assessors to be the total taxable value of land and additions on the property. | Land | Improvement |
|---|---|---|---|---|
| 2025 | $4,864 | $341,345 | $79,646 | $261,699 |
| 2023 | $4,864 | $328,092 | $76,554 | $251,538 |
| 2022 | $4,732 | $321,659 | $75,053 | $246,606 |
| 2021 | $4,632 | $315,353 | $73,582 | $241,771 |
| 2020 | $4,544 | $312,120 | $72,828 | $239,292 |
| 2019 | $4,473 | $306,000 | $71,400 | $234,600 |
| 2018 | $1,662 | $43,237 | $7,126 | $36,111 |
| 2017 | $1,635 | $42,390 | $6,987 | $35,403 |
| 2016 | $1,578 | $41,559 | $6,850 | $34,709 |
| 2015 | $1,583 | $40,938 | $6,749 | $34,189 |
| 2014 | $1,566 | $40,138 | $6,618 | $33,520 |
Source: Public Records
Map
Nearby Homes
- 16376 Bailey St
- 16427 Bailey St
- 1 Bailey St
- 15 Bailey St
- 0 E Stevens Unit DW25123440
- 0 E Stevens Unit SW25088148
- 0 E Stevens Unit DW25037646
- 7 Stevens St
- 16377 Lakeshore Dr Unit 4F
- 16377 Lakeshore Dr Unit 2C
- 16377 Lakeshore Dr Unit 2F
- 0 Swan Ave Unit OC25229033
- 0 Stevens #101-2
- 4678 Swan Ave
- 842 Porta Marina Ln
- 848 Porta Marina Ln
- 4671 Swan Ave
- 4665 Swan Ave
- 908 Ancona Ln
- 16395 Broadway St
- 30450 Jernigan St
- 30208 Jernigan St
- 30175 Hursh St
- 30150 Jernigan St
- 30105 Hursh St
- 30205 Hursh St
- 30704 Jernigan St
- 30100 Jernigan St
- 29849 Hursh St
- 16278 Cimarron Rd
- 29711 Hursh St
- 30601 Hursh St
- 30050 Jernigan St
- 16262 Cimarron Rd
- 29591 Hursh St
- 16292 Cimarron Rd
- 16306 Cimarron Rd
- 30380 Hursh St
- 29980 Hursh St
- 30300 Hursh St