3041 Reynard Rd Columbus, OH 43232
Walnut Heights NeighborhoodEstimated Value: $217,247 - $261,000
3
Beds
2
Baths
1,288
Sq Ft
$185/Sq Ft
Est. Value
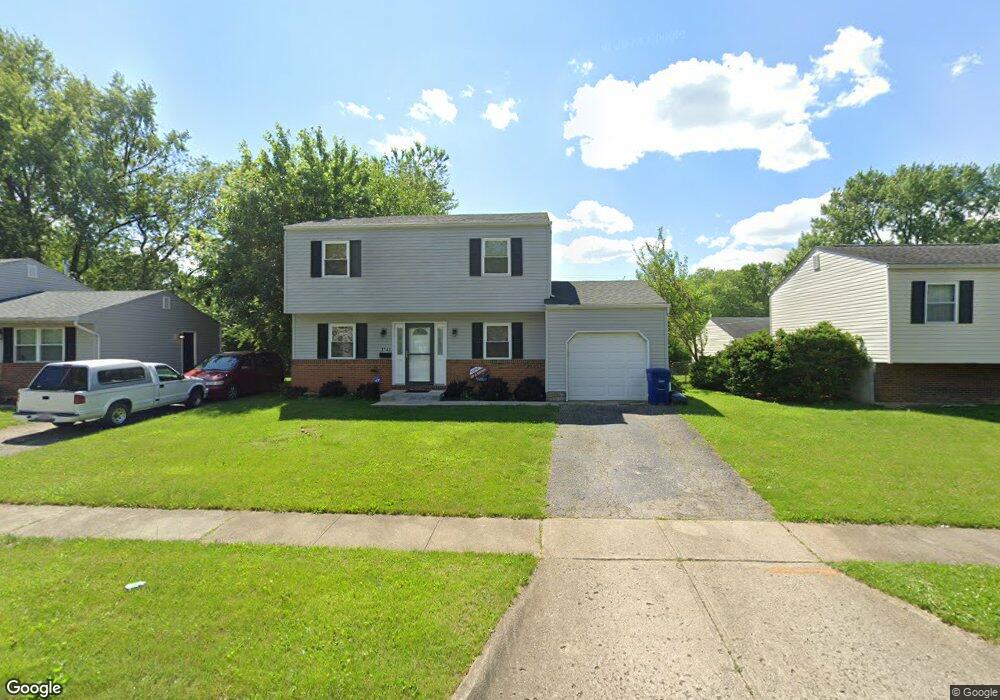
About This Home
This home is located at 3041 Reynard Rd, Columbus, OH 43232 and is currently estimated at $238,562, approximately $185 per square foot. 3041 Reynard Rd is a home located in Franklin County with nearby schools including Liberty Elementary School, Yorktown Middle School, and Independence High School.
Ownership History
Date
Name
Owned For
Owner Type
Purchase Details
Closed on
Aug 31, 2009
Sold by
Elro Enterprises Llc
Bought by
Megerle Christina J
Current Estimated Value
Home Financials for this Owner
Home Financials are based on the most recent Mortgage that was taken out on this home.
Original Mortgage
$63,797
Outstanding Balance
$41,211
Interest Rate
5.27%
Mortgage Type
FHA
Estimated Equity
$197,351
Purchase Details
Closed on
May 28, 2002
Sold by
Kates Ellen and Kates Rolf
Bought by
Elro Enterprises Llc
Purchase Details
Closed on
Oct 15, 2001
Sold by
Taylor Merlin E and Taylor Frances K
Bought by
Kates Rolf and Kates Ellen
Home Financials for this Owner
Home Financials are based on the most recent Mortgage that was taken out on this home.
Original Mortgage
$92,378
Interest Rate
6.88%
Mortgage Type
Purchase Money Mortgage
Purchase Details
Closed on
Jun 2, 1995
Sold by
Taylor Merlin E
Bought by
Rodney Sparks Trustee
Purchase Details
Closed on
Aug 20, 1979
Bought by
Taylor Merlin E
Create a Home Valuation Report for This Property
The Home Valuation Report is an in-depth analysis detailing your home's value as well as a comparison with similar homes in the area
Home Values in the Area
Average Home Value in this Area
Purchase History
| Date | Buyer | Sale Price | Title Company |
|---|---|---|---|
| Megerle Christina J | $65,000 | Arrow Title | |
| Elro Enterprises Llc | -- | -- | |
| Kates Rolf | $87,000 | Foundation Title Agency Inc | |
| Rodney Sparks Trustee | $60,000 | -- | |
| Taylor Merlin E | -- | -- |
Source: Public Records
Mortgage History
| Date | Status | Borrower | Loan Amount |
|---|---|---|---|
| Open | Megerle Christina J | $63,797 | |
| Previous Owner | Kates Rolf | $92,378 | |
| Closed | Rodney Sparks Trustee | $0 |
Source: Public Records
Tax History
| Year | Tax Paid | Tax Assessment Tax Assessment Total Assessment is a certain percentage of the fair market value that is determined by local assessors to be the total taxable value of land and additions on the property. | Land | Improvement |
|---|---|---|---|---|
| 2025 | $2,932 | $65,320 | $17,820 | $47,500 |
| 2024 | $2,932 | $65,320 | $17,820 | $47,500 |
| 2023 | $2,894 | $65,310 | $17,815 | $47,495 |
| 2022 | $1,643 | $31,680 | $6,300 | $25,380 |
| 2021 | $1,646 | $31,680 | $6,300 | $25,380 |
| 2020 | $1,648 | $31,680 | $6,300 | $25,380 |
| 2019 | $1,618 | $26,670 | $5,250 | $21,420 |
| 2018 | $1,556 | $26,670 | $5,250 | $21,420 |
| 2017 | $1,633 | $26,670 | $5,250 | $21,420 |
| 2016 | $1,649 | $24,890 | $4,340 | $20,550 |
| 2015 | $1,497 | $24,890 | $4,340 | $20,550 |
| 2014 | $1,500 | $24,890 | $4,340 | $20,550 |
| 2013 | $822 | $27,650 | $4,830 | $22,820 |
Source: Public Records
Map
Nearby Homes
- 5361 Parkline Dr
- 2998 Osgood Rd E
- 5373 Spire Ln
- 5290 Quincy Dr
- 3012 Argonne Ct
- 2900 Gentry Ln
- 5422 Everson Rd N
- 3302 Everson Rd E
- 5326 Adderley Ave
- 5143 Rutledge Dr N
- 5185 Rutledge Dr S
- 2908 Renfro Rd
- 5145 Rutledge Dr S
- 3246 Latonia Rd
- 5137 Holbrook Dr
- 5691 Matuka Dr
- 4942 Talbert Dr
- 5226 Lindora Dr
- 2651 Brownfield Rd
- 2627 Hubbell Rd
- 3033 Reynard Rd
- 3049 Reynard Rd
- 3025 Reynard Rd
- 3057 Reynard Rd
- 3042 Whitlow Rd
- 3050 Whitlow Rd
- 3038 Whitlow Rd
- 3058 Whitlow Rd
- 3040 Reynard Rd
- 3030 Reynard Rd Unit RIAT
- 3019 Reynard Rd Unit RIAT
- 3019 Reynard Rd
- 3065 Reynard Rd
- 3030 Whitlow Rd
- 3066 Whitlow Rd
- 3064 Reynard Rd
- 3022 Reynard Rd Unit RIAT
- 5398 Kedge Ln
- 3024 Reynard Rd
- 3011 Reynard Rd Unit RIAT
Your Personal Tour Guide
Ask me questions while you tour the home.