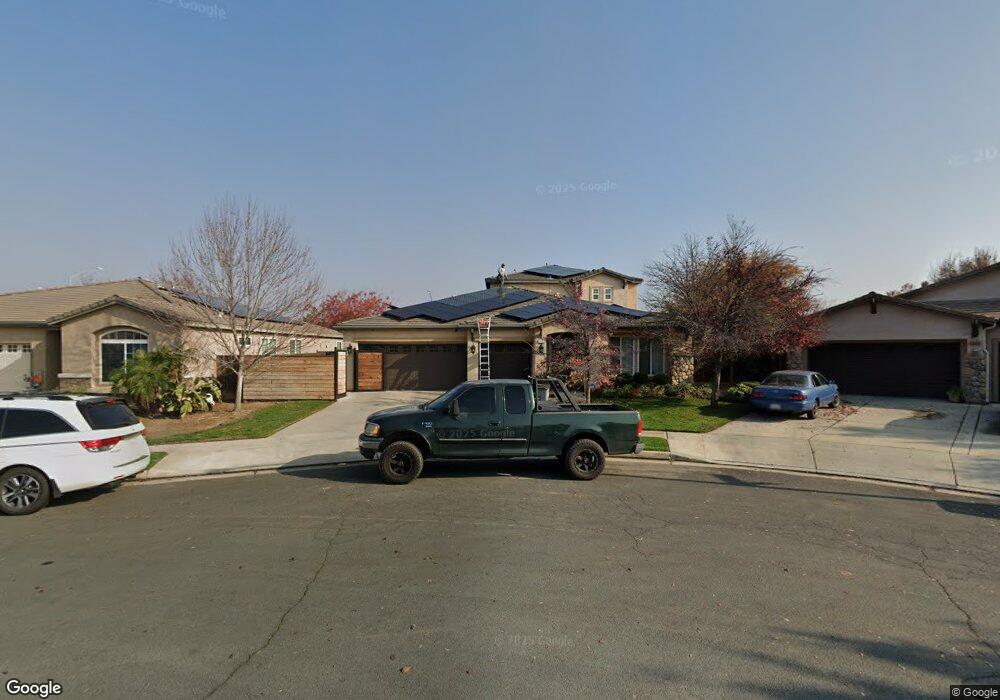
3042 N Douglas Ave Fresno, CA 93727
McLane NeighborhoodEstimated Value: $629,000 - $650,351
4
Beds
2
Baths
3,127
Sq Ft
$205/Sq Ft
Est. Value
About This Home
This home is located at 3042 N Douglas Ave, Fresno, CA 93727 and is currently estimated at $640,838, approximately $204 per square foot. 3042 N Douglas Ave is a home located in Fresno County with nearby schools including Tomahawk School, Roger S. Oraze Elementary School, and E. J. Marshall Elementary.
Ownership History
Date
Name
Owned For
Owner Type
Purchase Details
Closed on
Jul 21, 2009
Sold by
Fdic
Bought by
Yetter Ryan L and Yetter Carrie J
Current Estimated Value
Home Financials for this Owner
Home Financials are based on the most recent Mortgage that was taken out on this home.
Original Mortgage
$270,019
Outstanding Balance
$176,232
Interest Rate
5.31%
Mortgage Type
FHA
Estimated Equity
$464,606
Purchase Details
Closed on
Feb 19, 2009
Sold by
Wallace James E and Wallace Latisha Y
Bought by
Indymac Federal Bank Fsb
Purchase Details
Closed on
May 16, 2006
Sold by
Mcmillin Oxford Commons Llc
Bought by
Wallace James E and Wallace Latisha Y
Home Financials for this Owner
Home Financials are based on the most recent Mortgage that was taken out on this home.
Original Mortgage
$396,831
Interest Rate
7%
Mortgage Type
Purchase Money Mortgage
Create a Home Valuation Report for This Property
The Home Valuation Report is an in-depth analysis detailing your home's value as well as a comparison with similar homes in the area
Home Values in the Area
Average Home Value in this Area
Purchase History
| Date | Buyer | Sale Price | Title Company |
|---|---|---|---|
| Yetter Ryan L | $275,000 | Multiple | |
| Indymac Federal Bank Fsb | $249,680 | None Available | |
| Wallace James E | $496,500 | First American Title Company |
Source: Public Records
Mortgage History
| Date | Status | Borrower | Loan Amount |
|---|---|---|---|
| Open | Yetter Ryan L | $270,019 | |
| Previous Owner | Wallace James E | $396,831 |
Source: Public Records
Tax History Compared to Growth
Tax History
| Year | Tax Paid | Tax Assessment Tax Assessment Total Assessment is a certain percentage of the fair market value that is determined by local assessors to be the total taxable value of land and additions on the property. | Land | Improvement |
|---|---|---|---|---|
| 2025 | $4,850 | $377,273 | $90,351 | $286,922 |
| 2023 | $4,585 | $362,626 | $86,844 | $275,782 |
| 2022 | $4,496 | $355,517 | $85,142 | $270,375 |
| 2021 | $4,346 | $348,547 | $83,473 | $265,074 |
| 2020 | $4,335 | $344,974 | $82,618 | $262,356 |
| 2019 | $4,268 | $338,211 | $80,999 | $257,212 |
| 2018 | $3,955 | $311,972 | $79,411 | $232,561 |
| 2017 | $3,822 | $305,855 | $77,854 | $228,001 |
| 2016 | $3,700 | $299,859 | $76,328 | $223,531 |
| 2015 | $3,509 | $295,356 | $75,182 | $220,174 |
| 2014 | $3,457 | $285,000 | $65,000 | $220,000 |
Source: Public Records
Map
Nearby Homes
- 3062 N Filbert Ave
- 3329 N Shelly Ave
- 3342 N Carriage Ave
- 2788 N Douglas Ave
- 2870 N Sophie Dr
- 2756 N Douglas Ave
- 6406 E Giavanna Ave
- 2871 N Cypress Ave
- 2833 N Armstrong Ave
- 6083 E Andrews Ave
- 2648 N Armstrong Ave
- 6157 E Garland Ave
- 6399 E Millie Dr
- 6435 E Millie Dr
- 6351 E Millie Dr
- The Bella Plan at The Landing at Belterra - Traditional
- The Annie Plan at The Landing at Belterra - Traditional
- The Cali Plan at The Landing at Belterra - Traditional
- Villa 5 Plan at The Landing at Belterra - The Villas
- The Pasatiempo Plan at The Landing at Belterra - Traditional
- 3070 N Douglas Ave
- 6469 E Andrews Ave
- 6451 E Andrews Ave
- 3094 N Douglas Ave
- 6450 E Andrews Ave
- 6433 E Andrews Ave
- 3017 N Filbert Ave
- 6507 E Andrews Ave
- 3126 N Douglas Ave
- 3031 N Filbert Ave
- 3045 N Filbert Ave
- 6406 E Andrews Ave
- 6405 E Andrews Ave
- 3059 N Filbert Ave
- 6453 E Fountain Way
- 3142 N Douglas Ave
- 6519 E Andrews Ave
- 3073 N Filbert Ave
- 6401 E Fountain Way
- 6388 E Andrews Ave