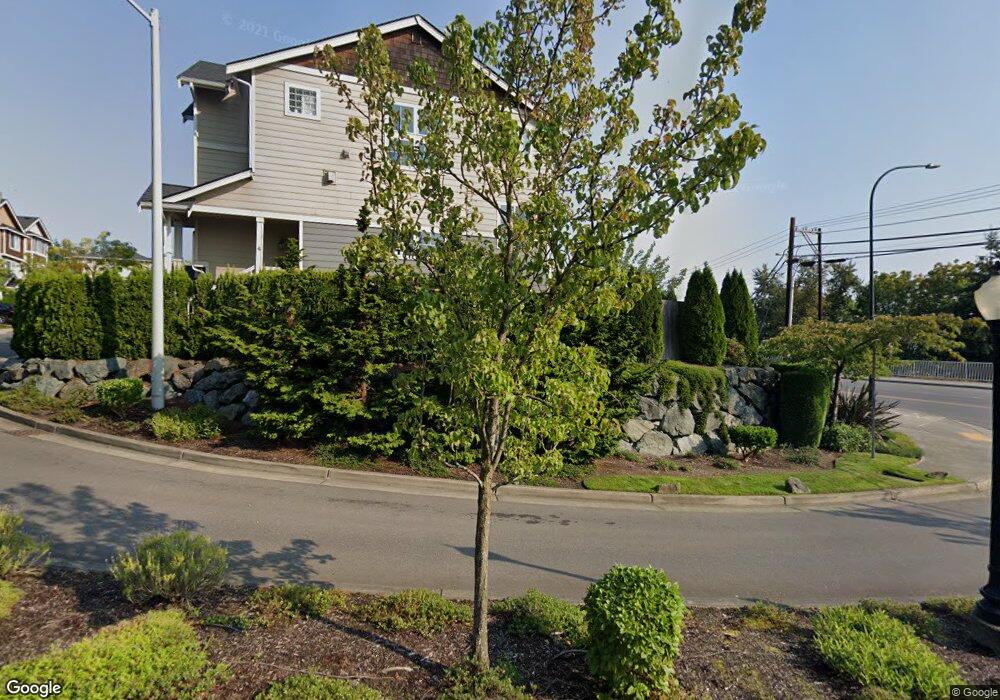
3043 Belmonte Ln Unit A4 Everett, WA 98201
Delta NeighborhoodEstimated Value: $553,000 - $635,000
3
Beds
3
Baths
2,125
Sq Ft
$278/Sq Ft
Est. Value
About This Home
This home is located at 3043 Belmonte Ln Unit A4, Everett, WA 98201 and is currently estimated at $590,825, approximately $278 per square foot. 3043 Belmonte Ln Unit A4 is a home located in Snohomish County with nearby schools including Hawthorne Elementary School, North Middle School, and Everett High School.
Ownership History
Date
Name
Owned For
Owner Type
Purchase Details
Closed on
Dec 26, 2012
Sold by
Fannie Mae
Bought by
Judd Deborah J
Current Estimated Value
Home Financials for this Owner
Home Financials are based on the most recent Mortgage that was taken out on this home.
Original Mortgage
$153,600
Outstanding Balance
$103,999
Interest Rate
3.27%
Mortgage Type
New Conventional
Estimated Equity
$486,826
Purchase Details
Closed on
Jul 6, 2012
Sold by
Drake Brandon and Drake Daniela
Bought by
Federal National Mortgage Association
Purchase Details
Closed on
Sep 7, 2007
Sold by
Belmonte Heights Llc
Bought by
Drake Brandon and Drake Daniela
Home Financials for this Owner
Home Financials are based on the most recent Mortgage that was taken out on this home.
Original Mortgage
$334,950
Interest Rate
6.67%
Mortgage Type
Purchase Money Mortgage
Create a Home Valuation Report for This Property
The Home Valuation Report is an in-depth analysis detailing your home's value as well as a comparison with similar homes in the area
Home Values in the Area
Average Home Value in this Area
Purchase History
| Date | Buyer | Sale Price | Title Company |
|---|---|---|---|
| Judd Deborah J | -- | Old Republic Title Ltd | |
| Federal National Mortgage Association | -- | Old Republic Title Ltd | |
| Drake Brandon | $334,990 | Pacific Northwest Title Comp |
Source: Public Records
Mortgage History
| Date | Status | Borrower | Loan Amount |
|---|---|---|---|
| Open | Judd Deborah J | $153,600 | |
| Previous Owner | Drake Brandon | $334,950 |
Source: Public Records
Tax History
| Year | Tax Paid | Tax Assessment Tax Assessment Total Assessment is a certain percentage of the fair market value that is determined by local assessors to be the total taxable value of land and additions on the property. | Land | Improvement |
|---|---|---|---|---|
| 2026 | $4,752 | $575,600 | $284,800 | $290,800 |
| 2025 | $4,086 | $545,100 | $268,200 | $276,900 |
| 2024 | $4,086 | $475,800 | $198,900 | $276,900 |
| 2023 | $4,275 | $520,600 | $201,600 | $319,000 |
| 2022 | $3,515 | $383,900 | $126,800 | $257,100 |
| 2020 | $3,796 | $338,200 | $107,000 | $231,200 |
| 2019 | $3,489 | $312,800 | $83,700 | $229,100 |
| 2018 | $3,377 | $277,500 | $72,400 | $205,100 |
| 2017 | $3,371 | $275,900 | $69,700 | $206,200 |
| 2016 | $2,981 | $256,500 | $57,600 | $198,900 |
| 2015 | $3,069 | $248,700 | $55,600 | $193,100 |
| 2013 | $2,359 | $168,700 | $45,600 | $123,100 |
Source: Public Records
Map
Nearby Homes
- 1 xx Hawthorne St
- 833 E Marine View Dr
- 901 E Marine View Dr Unit 201
- 3401 N Broadway
- 2316 7th St
- 2314 8th St
- 1118 Chestnut Ct Unit 18
- 2800 35th Ave NE
- 1328 Chestnut St
- 1409 E Marine View Dr
- 1035 Oakes Ave
- 1022 Oakes Ave
- 606 Wetmore Ave
- 512 Wetmore Ave
- 416 Alverson Blvd
- 1027 Wetmore Ave
- 1523 Virginia Ave
- 1601 Virginia Ave
- 1621 Baker Ave
- 2707 18th St
- 3041 Belmonte Ln Unit A3
- 3041 Belmonte Ln
- 3039 Belmonte Ln Unit A2
- 3039 Belmonte Ln
- 3043 Belmonte Ln
- 3037 Belmonte Ln Unit A-1
- 3037 Belmonte Ln
- 3035 Belmonte Ln Unit B4
- 3035 Belmonte Ln
- 3033 Belmonte Ln Unit B3
- 3033 Belmonte Ln
- 3042 Belmonte Ln Unit F1
- 3042 Belmonte Ln
- 3044 Belmonte Ln
- 3040 Belmonte Ln Unit 85
- 3040 Belmonte Ln
- 3046 Belmonte Ln
- 3048 Belmonte Ln
- 3029 Belmonte Ln
- 3038 Belmonte Ln Unit F3
Your Personal Tour Guide
Ask me questions while you tour the home.