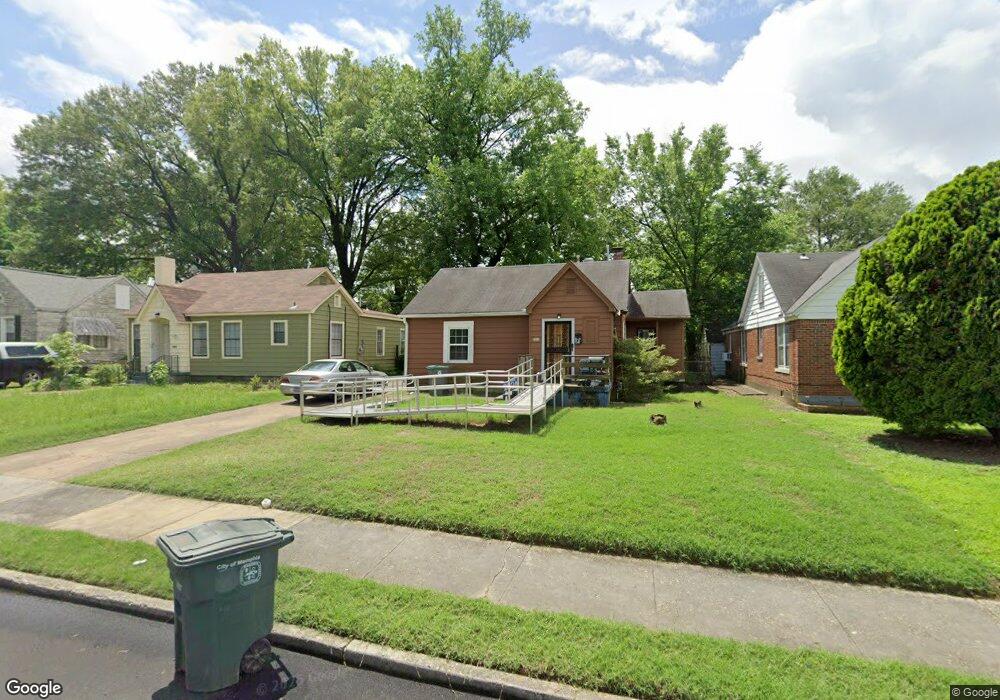
3043 Chisca Ave Memphis, TN 38111
Orange Mound NeighborhoodEstimated Value: $65,000 - $88,000
2
Beds
1
Bath
1,263
Sq Ft
$64/Sq Ft
Est. Value
About This Home
This home is located at 3043 Chisca Ave, Memphis, TN 38111 and is currently estimated at $81,070, approximately $64 per square foot. 3043 Chisca Ave is a home located in Shelby County with nearby schools including Sherwood Middle, Melrose High School, and Hanley Schoool - Middle.
Ownership History
Date
Name
Owned For
Owner Type
Purchase Details
Closed on
May 31, 2012
Sold by
Pruitt Lamont
Bought by
Pruitt Lamont and Moorman Nellie
Current Estimated Value
Purchase Details
Closed on
Aug 10, 2010
Sold by
Federal Home Loan Mortgage Corporation
Bought by
Pruitt Lamont
Purchase Details
Closed on
May 7, 2010
Sold by
Vowell Amie R and Vowell Stewart
Bought by
Federal Home Loan Mortgage Corp
Purchase Details
Closed on
Apr 25, 2003
Sold by
Arnette Charles
Bought by
Vowell Amie
Purchase Details
Closed on
Aug 6, 2001
Sold by
Arnette Ann E
Bought by
Arnette Charles A
Create a Home Valuation Report for This Property
The Home Valuation Report is an in-depth analysis detailing your home's value as well as a comparison with similar homes in the area
Home Values in the Area
Average Home Value in this Area
Purchase History
| Date | Buyer | Sale Price | Title Company |
|---|---|---|---|
| Pruitt Lamont | -- | None Available | |
| Pruitt Lamont | $11,000 | Servicelink Hopewell Campus | |
| Federal Home Loan Mortgage Corp | $13,500 | None Available | |
| Vowell Amie | $40,000 | Title Enterprise Service Co | |
| Arnette Charles A | -- | Memphis Title | |
| Arnette Charles A | -- | Memphis Title |
Source: Public Records
Tax History
| Year | Tax Paid | Tax Assessment Tax Assessment Total Assessment is a certain percentage of the fair market value that is determined by local assessors to be the total taxable value of land and additions on the property. | Land | Improvement |
|---|---|---|---|---|
| 2025 | -- | $19,850 | $2,450 | $17,400 |
| 2024 | $442 | $13,050 | $1,000 | $12,050 |
| 2023 | $795 | $13,050 | $1,000 | $12,050 |
| 2022 | $795 | $13,050 | $1,000 | $12,050 |
| 2021 | $945 | $13,050 | $1,000 | $12,050 |
| 2020 | $593 | $9,175 | $1,000 | $8,175 |
| 2019 | $293 | $9,175 | $1,000 | $8,175 |
| 2018 | $293 | $9,175 | $1,000 | $8,175 |
| 2017 | $300 | $9,175 | $1,000 | $8,175 |
| 2016 | $393 | $9,000 | $0 | $0 |
| 2014 | $393 | $9,000 | $0 | $0 |
Source: Public Records
Map
Nearby Homes
- 828 Semmes St
- 820 Semmes St
- 818 Semmes St
- 3051 Park Ave
- 767 Semmes St
- 3174 Chisca Ave
- 961 Aubra Rd
- 2892 Douglass Ave
- 2885 Carnes Ave
- 938 Inman Rd
- 2868 Choctaw Ave
- 721 Inez St
- 2859 Carnes Ave
- 2851 Carnes Ave
- 2974 Waverly Ave
- 3236 Park Ave
- 2841 Carnes Ave
- 2839 Carnes Ave
- 3246 Chisca Ave
- 3061 Southern Ave
Your Personal Tour Guide
Ask me questions while you tour the home.