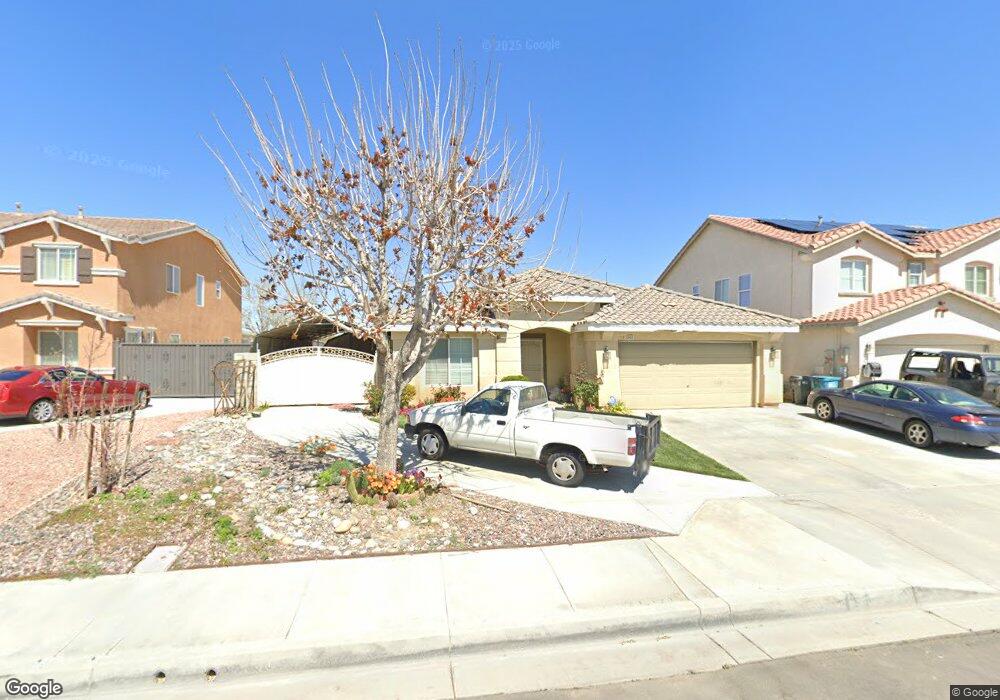
3043 Kachina Ct Lancaster, CA 93535
East Lancaster NeighborhoodEstimated Value: $486,632 - $509,000
3
Beds
2
Baths
1,945
Sq Ft
$258/Sq Ft
Est. Value
About This Home
This home is located at 3043 Kachina Ct, Lancaster, CA 93535 and is currently estimated at $501,408, approximately $257 per square foot. 3043 Kachina Ct is a home located in Los Angeles County with nearby schools including Eastside Elementary School, Gifford C. Cole Middle School, and Eastside High School.
Ownership History
Date
Name
Owned For
Owner Type
Purchase Details
Closed on
Sep 19, 2023
Sold by
Lopez Moises A and Lopez Thelma G
Bought by
Moises And Thelma Lopez 2023 Trust and Lopez
Current Estimated Value
Purchase Details
Closed on
Mar 16, 2011
Sold by
Aurora Loan Services Llc
Bought by
Lopez Moises and Lopez Thelma
Home Financials for this Owner
Home Financials are based on the most recent Mortgage that was taken out on this home.
Original Mortgage
$123,780
Interest Rate
5.5%
Mortgage Type
FHA
Purchase Details
Closed on
Jul 30, 2010
Sold by
Santiago Maria Victoria T
Bought by
Aurora Loan Services Llc
Purchase Details
Closed on
Aug 15, 2005
Sold by
Kb Home Greater Los Angeles Inc
Bought by
Santiago Maria Victoria T
Home Financials for this Owner
Home Financials are based on the most recent Mortgage that was taken out on this home.
Original Mortgage
$250,440
Interest Rate
5.7%
Mortgage Type
Fannie Mae Freddie Mac
Create a Home Valuation Report for This Property
The Home Valuation Report is an in-depth analysis detailing your home's value as well as a comparison with similar homes in the area
Home Values in the Area
Average Home Value in this Area
Purchase History
| Date | Buyer | Sale Price | Title Company |
|---|---|---|---|
| Moises And Thelma Lopez 2023 Trust | -- | None Listed On Document | |
| Lopez Moises | $127,000 | Lsi Title Company | |
| Aurora Loan Services Llc | $266,329 | Accommodation | |
| Santiago Maria Victoria T | $313,500 | First American Title Co |
Source: Public Records
Mortgage History
| Date | Status | Borrower | Loan Amount |
|---|---|---|---|
| Previous Owner | Lopez Moises | $123,780 | |
| Previous Owner | Santiago Maria Victoria T | $250,440 |
Source: Public Records
Tax History Compared to Growth
Tax History
| Year | Tax Paid | Tax Assessment Tax Assessment Total Assessment is a certain percentage of the fair market value that is determined by local assessors to be the total taxable value of land and additions on the property. | Land | Improvement |
|---|---|---|---|---|
| 2025 | $3,414 | $162,696 | $32,534 | $130,162 |
| 2024 | $3,414 | $159,507 | $31,897 | $127,610 |
| 2023 | $3,320 | $156,380 | $31,272 | $125,108 |
| 2022 | $3,182 | $153,314 | $30,659 | $122,655 |
| 2021 | $2,823 | $150,308 | $30,058 | $120,250 |
| 2019 | $2,771 | $145,851 | $29,167 | $116,684 |
| 2018 | $2,728 | $142,993 | $28,596 | $114,397 |
| 2016 | $2,609 | $137,442 | $27,487 | $109,955 |
| 2015 | $2,577 | $135,379 | $27,075 | $108,304 |
| 2014 | $2,704 | $132,728 | $26,545 | $106,183 |
Source: Public Records
Map
Nearby Homes
- 3116 Kilt Ct
- 2842 El Sol Dr
- 3056 Peaceful Way
- 43516 32nd St E
- 3141 E Avenue j14
- 43716 San Francisco Ave
- 43757 Rucker St
- 43730 San Francisco Ave
- 43749 San Francisco Ave
- 43656 La Paz Ln
- Vl Apn 3170-007-020
- 3320 Kipper Ct
- 43716 La Paz Ln
- 2831 San Miguel Dr
- 43841 30th St E
- 43611 Easy St
- 3030 Holline Ct
- 0 Cor Avenue K 35th Ste Unit 25001141
- 3009 Kaylyn St
- 43921 30th St E
- 3049 Kachina Ct
- 3039 Kachina Ct
- 3055 Kachina Ct
- 3033 Kachina Ct
- 3046 Kachina Ct
- 3040 Kachina Ct
- 3063 Kachina Ct
- 3027 Kachina Ct
- 3052 Kachina Ct
- 3034 Kachina Ct
- 3058 Kachina Ct
- 43609 Artesia Mill Ct
- 3103 Kachina Ct
- 3028 Kachina Ct
- 3064 Kachina Ct
- 43613 Artesia Mill Ct
- 3019 Kachina Ct
- 43610 Artesia Mill Ct
- 3045 Kilt Ct
- 43614 Rucker Ct