T
Landlord's Agent in 2024
Teresa Lents
Dropped Members
Estimated Value: $287,000 - $312,000
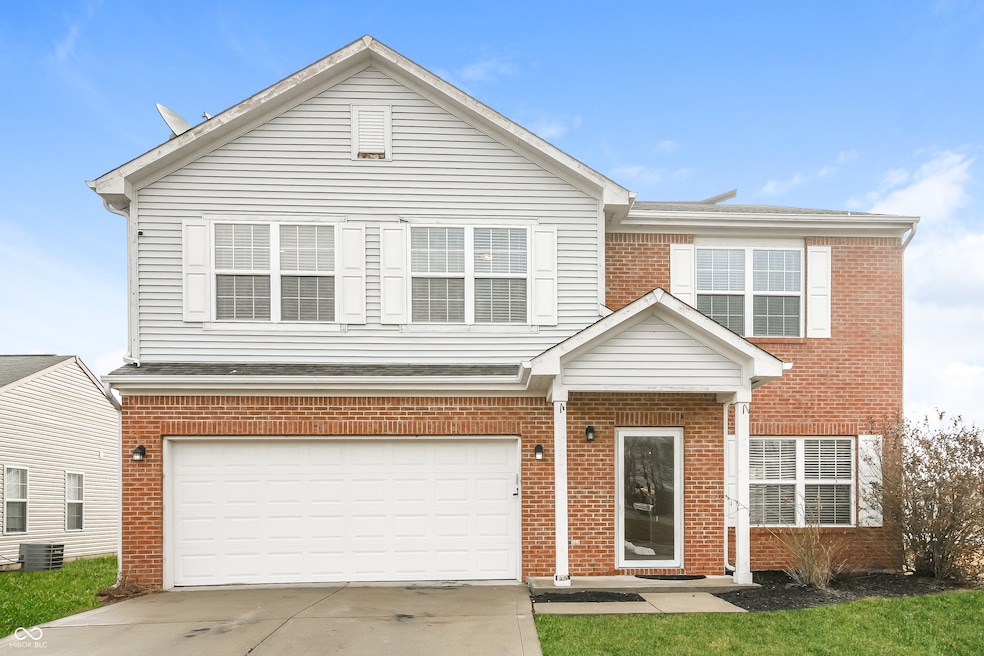
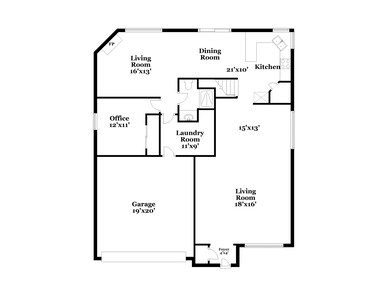
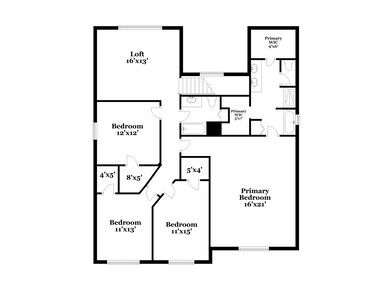
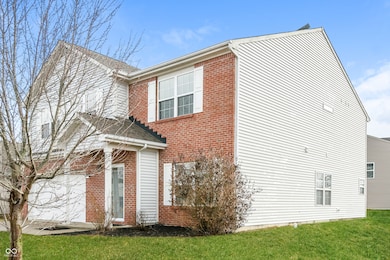
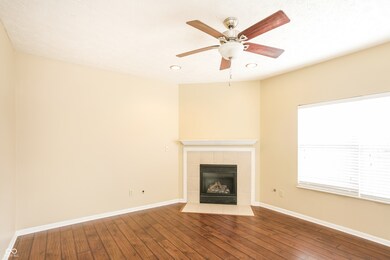
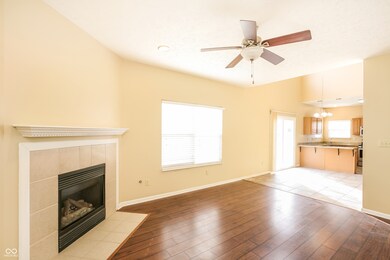
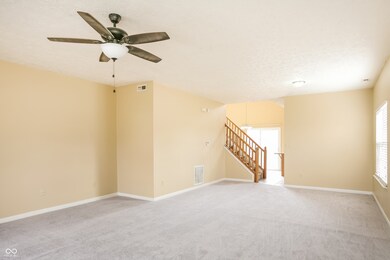
Looking for your dream home? Through our seamless leasing process, this beautifully designed home is move-in ready. Our spacious layout is perfect for comfortable living that you can enjoy with your pets too; we're proud to be pet friendly. Our homes are built using high-quality, eco-friendly materials with neutral paint colors, updated fixtures, and energy-efficient appliances. Enjoy the backyard and community to unwind after a long day, or simply greet neighbors, enjoy the fresh air, and gather for fun-filled activities. Ready to make your next move your best move? We'll never ask you to wire money or request funds through a payment app via mobile. The fixtures and finishes of this property may differ slightly from what is pictured.
Last Agent to Rent the Property
Teresa Lents
Dropped Members Brokerage Email: tlents@msrenewal.com License #RB14050073 Listed on: 08/25/2024
| Date | Buyer | Sale Price | Title Company |
|---|---|---|---|
| Baf Assets Llc | -- | None Available | |
| Us Sfe Asset Company 3 Llc | -- | None Available | |
| Kaur Manjit | -- | None Available |
| Date | Status | Borrower | Loan Amount |
|---|---|---|---|
| Previous Owner | Kaur Manjit | $115,000 |
| Date | Event | Price | List to Sale | Price per Sq Ft | Prior Sale |
|---|---|---|---|---|---|
| 12/09/2024 12/09/24 | Rented | $1,990 | 0.0% | -- | |
| 10/28/2024 10/28/24 | Under Contract | -- | -- | -- | |
| 09/11/2024 09/11/24 | Price Changed | $1,990 | -1.2% | $1 / Sq Ft | |
| 08/25/2024 08/25/24 | For Rent | $2,015 | +3.6% | -- | |
| 05/12/2023 05/12/23 | Rented | $1,945 | -4.9% | -- | |
| 04/12/2023 04/12/23 | Under Contract | -- | -- | -- | |
| 03/27/2023 03/27/23 | For Rent | $2,045 | +16.9% | -- | |
| 03/09/2021 03/09/21 | Rented | $1,750 | 0.0% | -- | |
| 03/02/2021 03/02/21 | For Rent | $1,750 | +13.3% | -- | |
| 06/11/2015 06/11/15 | Rented | $1,545 | 0.0% | -- | |
| 06/11/2015 06/11/15 | Under Contract | -- | -- | -- | |
| 04/18/2015 04/18/15 | For Rent | $1,545 | 0.0% | -- | |
| 01/09/2015 01/09/15 | Sold | $135,000 | -12.9% | $46 / Sq Ft | View Prior Sale |
| 12/19/2014 12/19/14 | Pending | -- | -- | -- | |
| 12/15/2014 12/15/14 | Price Changed | $154,990 | 0.0% | $53 / Sq Ft | |
| 10/16/2014 10/16/14 | For Sale | $155,000 | -- | $53 / Sq Ft |
| Year | Tax Paid | Tax Assessment Tax Assessment Total Assessment is a certain percentage of the fair market value that is determined by local assessors to be the total taxable value of land and additions on the property. | Land | Improvement |
|---|---|---|---|---|
| 2025 | $3,486 | $256,700 | $56,000 | $200,700 |
| 2024 | $3,486 | $166,900 | $56,000 | $110,900 |
| 2023 | $4,113 | $166,900 | $56,000 | $110,900 |
| 2022 | $3,467 | $166,900 | $29,900 | $137,000 |
| 2021 | $3,481 | $166,900 | $29,900 | $137,000 |
| 2020 | $3,504 | $166,900 | $29,900 | $137,000 |
| 2019 | $3,504 | $166,900 | $29,900 | $137,000 |
| 2018 | $2,725 | $129,800 | $20,900 | $108,900 |
| 2017 | $2,606 | $129,800 | $20,900 | $108,900 |
| 2016 | $2,596 | $129,800 | $20,900 | $108,900 |
| 2014 | $3,060 | $153,000 | $25,500 | $127,500 |
| 2013 | $3,060 | $154,400 | $25,500 | $128,900 |
T
Landlord's Agent in 2024
Teresa Lents
Dropped Members
R
Seller's Agent in 2021
Ryan Wolfe
Main Street Renewal, LLC
(317) 437-5730
M
Seller's Agent in 2015
Megan Bowman

Seller's Agent in 2015
Beenu Sikand
Legacy Homes International
(317) 670-1055
34 in this area
177 Total Sales
H
Seller Co-Listing Agent in 2015
Holly Canter
Brandywine Homes USA
(463) 222-7003
7 Total Sales
S
Buyer's Agent in 2015
Spencer Lindahl
Main Street Renewal, LLC
Source: MIBOR Broker Listing Cooperative®
MLS Number: 21998063
APN: 41-05-17-022-058.000-030
Disclaimer: Certain information contained herein is derived from information provided by parties other than Homes.com. All information provided is deemed reliable, but is not guaranteed to be accurate and should be independently verified.
![]() Based on information submitted to the MLS GRID. All data is obtained from various sources and may not have been verified by broker or MLS GRID. Supplied Open House Information is subject to change without notice. All information should be independently reviewed and verified for accuracy. Properties may or may not be listed by the office/agent presenting the information. Some IDX listings have been excluded from this website.
Based on information submitted to the MLS GRID. All data is obtained from various sources and may not have been verified by broker or MLS GRID. Supplied Open House Information is subject to change without notice. All information should be independently reviewed and verified for accuracy. Properties may or may not be listed by the office/agent presenting the information. Some IDX listings have been excluded from this website.