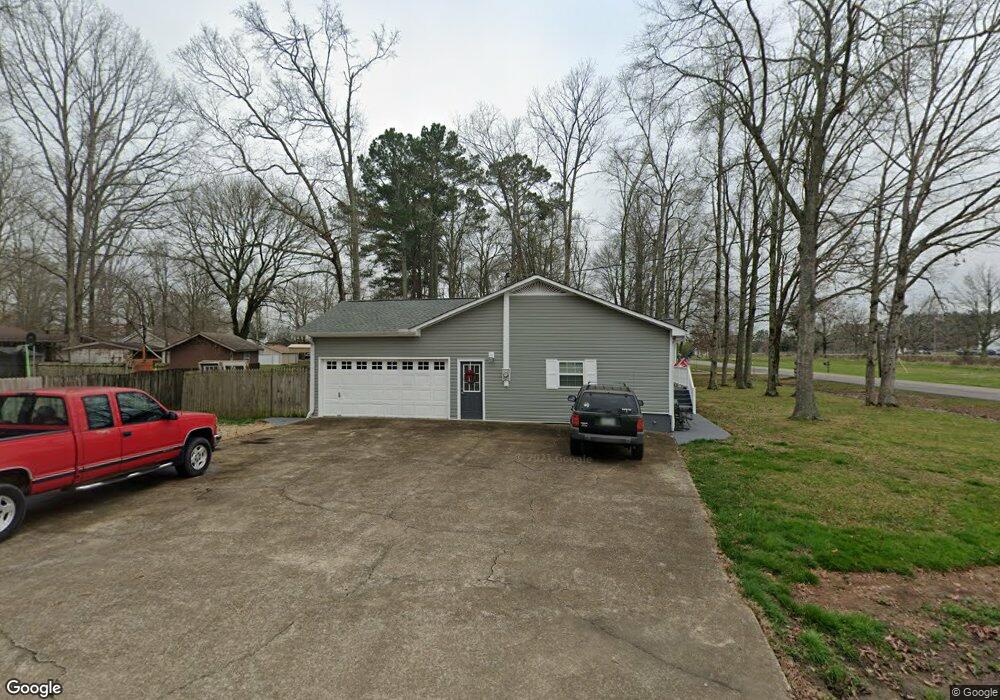
30436 Austin St Ardmore, TN 38449
Estimated Value: $197,000 - $256,000
Studio
2
Baths
1,849
Sq Ft
$120/Sq Ft
Est. Value
About This Home
This home is located at 30436 Austin St, Ardmore, TN 38449 and is currently estimated at $222,744, approximately $120 per square foot. 30436 Austin St is a home located in Giles County with nearby schools including Elkton Elementary School and Giles County High School.
Ownership History
Date
Name
Owned For
Owner Type
Purchase Details
Closed on
Sep 15, 2012
Sold by
Stevenson Robert C
Bought by
Stevenson Robert C and Stevenson Jodi L
Current Estimated Value
Home Financials for this Owner
Home Financials are based on the most recent Mortgage that was taken out on this home.
Original Mortgage
$69,000
Outstanding Balance
$47,822
Interest Rate
3.68%
Mortgage Type
Commercial
Estimated Equity
$174,922
Purchase Details
Closed on
Dec 18, 2002
Sold by
Stevenson Robert C
Bought by
Stevenson Robert C
Purchase Details
Closed on
Jun 30, 1995
Bought by
Stevenson Robert C and Carroll Jodie L
Purchase Details
Closed on
Dec 29, 1994
Bought by
Mullins T R %Mike Curry
Purchase Details
Closed on
Jul 3, 1991
Bought by
Turri Francis J
Purchase Details
Closed on
May 31, 1985
Bought by
Alley Lloyd K
Purchase Details
Closed on
Jan 1, 1981
Create a Home Valuation Report for This Property
The Home Valuation Report is an in-depth analysis detailing your home's value as well as a comparison with similar homes in the area
Purchase History
| Date | Buyer | Sale Price | Title Company |
|---|---|---|---|
| Stevenson Robert C | -- | -- | |
| Stevenson Robert C | -- | -- | |
| Stevenson Robert C | $77,500 | -- | |
| Mullins T R %Mike Curry | $60,000 | -- | |
| Turri Francis J | $70,000 | -- | |
| Alley Lloyd K | -- | -- | |
| -- | $2,500 | -- |
Source: Public Records
Mortgage History
| Date | Status | Borrower | Loan Amount |
|---|---|---|---|
| Open | Stevenson Robert C | $69,000 |
Source: Public Records
Tax History
| Year | Tax Paid | Tax Assessment Tax Assessment Total Assessment is a certain percentage of the fair market value that is determined by local assessors to be the total taxable value of land and additions on the property. | Land | Improvement |
|---|---|---|---|---|
| 2025 | $1,102 | $44,400 | $3,875 | $40,525 |
| 2024 | $953 | $44,400 | $3,875 | $40,525 |
| 2023 | $953 | $44,400 | $3,875 | $40,525 |
| 2022 | $953 | $44,400 | $3,875 | $40,525 |
| 2021 | $793 | $25,875 | $1,200 | $24,675 |
| 2020 | $793 | $25,875 | $1,200 | $24,675 |
| 2019 | $731 | $25,875 | $1,200 | $24,675 |
| 2018 | $792 | $25,875 | $1,200 | $24,675 |
| 2017 | $792 | $25,875 | $1,200 | $24,675 |
| 2016 | $857 | $26,675 | $2,000 | $24,675 |
| 2015 | $803 | $26,675 | $2,000 | $24,675 |
| 2014 | $807 | $26,807 | $0 | $0 |
Source: Public Records
Map
Nearby Homes
- 30679 Ardmore Ridge Rd
- 26081 Pheasant Run
- 29875 1st Ave E
- 3.81 Acres Alabama 53
- 30619 Highway 110
- 30065 Bankston Rd
- .86 acres Whitt St
- 29854 Ardmore Ave
- 516 Stevenson Rd
- 0 Union Hill Rd Unit RTC3066715
- 0 Union Hill Rd Unit RTC3066716
- 0 Union Hill Rd Unit RTC3066714
- 0 Union Hill Rd Unit RTC3066717
- 30A Stevenson Rd
- 30acres Stevenson Rd
- 24994 7th St
- 25433 7th St
- 25467 7th St
- 29401 Alabama 251
- 27615 Shannon Rd
- 30404 Austin St
- 30429 Sims St
- 30411 Sims St
- 30385 Sims St
- 30390 Austin St
- 30582 Highland Dr
- 30368 Austin St
- 0 Savings Center Dr Unit 1064661
- 30580 Highland Dr
- 30426 Highland Dr
- 30426 Sims St
- 30345 Sims St
- 30530 Highland Dr
- 30402 Sims St
- 30390 Sims St
- 30297 Sims St
- 30524 Highland Dr
- 30515 Highland Dr
- 30340 Sims St
- 30325 Austin St
Your Personal Tour Guide
Ask me questions while you tour the home.