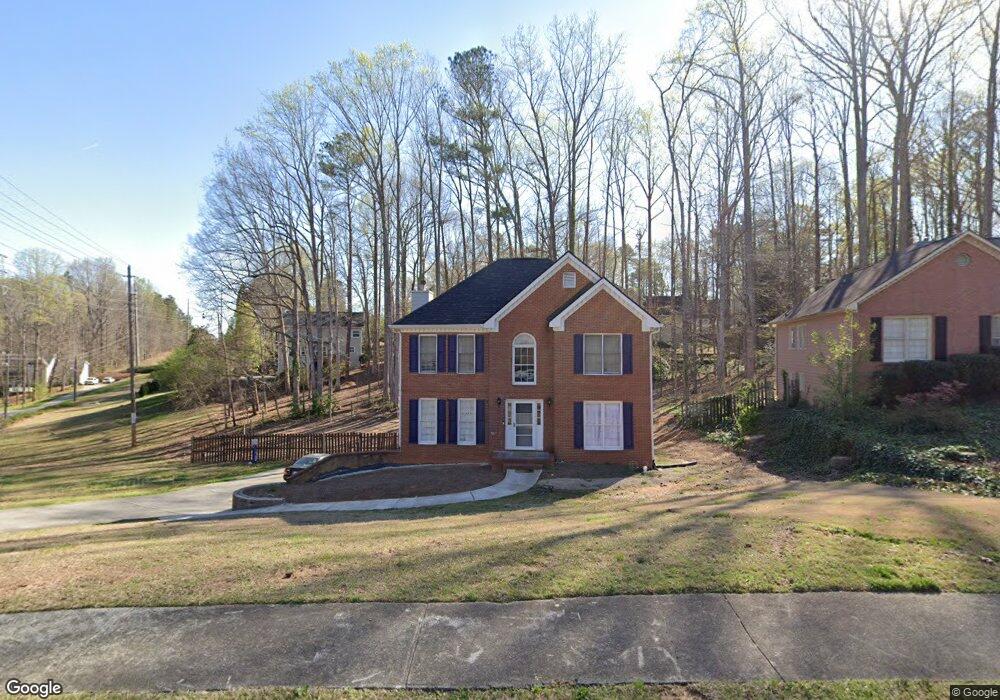
3044 Milford Chse Ovrlk SW Unit 4 Marietta, GA 30008
Southwestern Marietta NeighborhoodEstimated Value: $389,000 - $403,282
3
Beds
3
Baths
1,948
Sq Ft
$202/Sq Ft
Est. Value
About This Home
This home is located at 3044 Milford Chse Ovrlk SW Unit 4, Marietta, GA 30008 and is currently estimated at $394,071, approximately $202 per square foot. 3044 Milford Chse Ovrlk SW Unit 4 is a home located in Cobb County with nearby schools including Birney Elementary School, Smitha Middle School, and Osborne High School.
Ownership History
Date
Name
Owned For
Owner Type
Purchase Details
Closed on
Feb 26, 2024
Sold by
Velasquez Marily
Bought by
Velasquez Marily and Velasquez Joaquin
Current Estimated Value
Purchase Details
Closed on
Sep 3, 2021
Sold by
Hampton Zedrick M and Hampton Jodi M
Bought by
Velasquez Marily
Home Financials for this Owner
Home Financials are based on the most recent Mortgage that was taken out on this home.
Original Mortgage
$304,385
Interest Rate
2.8%
Mortgage Type
FHA
Purchase Details
Closed on
May 18, 2006
Sold by
Overstreet Willie E and Overstreet Mary A
Bought by
Hampton Zedrick M and Hampton Jodi M
Home Financials for this Owner
Home Financials are based on the most recent Mortgage that was taken out on this home.
Original Mortgage
$190,350
Interest Rate
6.51%
Mortgage Type
FHA
Create a Home Valuation Report for This Property
The Home Valuation Report is an in-depth analysis detailing your home's value as well as a comparison with similar homes in the area
Home Values in the Area
Average Home Value in this Area
Purchase History
| Date | Buyer | Sale Price | Title Company |
|---|---|---|---|
| Velasquez Marily | -- | None Listed On Document | |
| Velasquez Marily | -- | None Listed On Document | |
| Velasquez Marily | $310,000 | None Available | |
| Hampton Zedrick M | $193,200 | -- |
Source: Public Records
Mortgage History
| Date | Status | Borrower | Loan Amount |
|---|---|---|---|
| Previous Owner | Velasquez Marily | $304,385 | |
| Previous Owner | Hampton Zedrick M | $190,350 |
Source: Public Records
Tax History Compared to Growth
Tax History
| Year | Tax Paid | Tax Assessment Tax Assessment Total Assessment is a certain percentage of the fair market value that is determined by local assessors to be the total taxable value of land and additions on the property. | Land | Improvement |
|---|---|---|---|---|
| 2025 | $3,684 | $144,044 | $35,200 | $108,844 |
| 2024 | $3,687 | $144,044 | $35,200 | $108,844 |
| 2023 | $3,035 | $139,000 | $10,000 | $129,000 |
| 2022 | $3,152 | $118,364 | $10,000 | $108,364 |
| 2021 | $2,500 | $98,612 | $10,000 | $88,612 |
| 2020 | $2,421 | $95,036 | $10,000 | $85,036 |
| 2019 | $2,202 | $85,012 | $10,000 | $75,012 |
| 2018 | $2,202 | $85,012 | $10,000 | $75,012 |
| 2017 | $1,744 | $69,580 | $10,000 | $59,580 |
| 2016 | $1,745 | $69,580 | $10,000 | $59,580 |
| 2015 | $1,437 | $57,604 | $8,000 | $49,604 |
| 2014 | $1,449 | $57,604 | $0 | $0 |
Source: Public Records
Map
Nearby Homes
- 3055 Milford Chase Overlook SW
- 3123 Milford Chase SW
- 3145 Fern Valley Dr SW
- 1719 Silverchase Dr SW
- 0 Burfordi Dr SW Unit 7658493
- 0 Burfordi Dr SW Unit 10637361
- 1618 Sparrow Wood Ln SW
- 2700 Flintlock Ln SW
- 3106 Sasanqua Ln SW
- 1559 Woodmore Dr SW
- 1613 Sparrow Wood Ln SW Unit 3
- 3075 Milford Chase SW
- 1697 Rustic Dr SW
- 3340 Vineland Dr SW
- 1427 Lost Bridge Rd
- 3000 Fern Valley Dr SW
- 2099 Redbud Ct SW
- 2060 Powder Springs Rd SW
- 1308 Willamette Way
- 3044 Milford Chase SW
- 3044 Milford Chase Overlook SW
- 3046 Milford Chase SW
- 2941 Milford Courts SW
- 2951 Milford Courts SW
- 2931 Milford Courts SW
- 3042 Milford Chase Overlook SW Unit X
- 3042 Milford Chase Overlook SW
- 3042 Milford Chase Overlook SW Unit 6
- 3050 Milford Chse Ovrlk SW
- 3050 Milford Chase SW Unit VII
- 3046 Milford Chase Overlook SW
- 2961 Milford Courts SW
- 3043 Milford Chse Ovrlk SW Unit 6
- 3048 Milford Chase Overlook SW
- 2921 Milford Courts SW
- 3040 Milford Chase Overlook SW
- 3053 Milford Chase Overlook SW
- 3040 Milford Chase Overlook SW
- 3052 Milford Chase SW