3045 S 400 E Bountiful, UT 84010
Estimated Value: $603,000 - $684,483
4
Beds
2
Baths
2,019
Sq Ft
$324/Sq Ft
Est. Value
About This Home
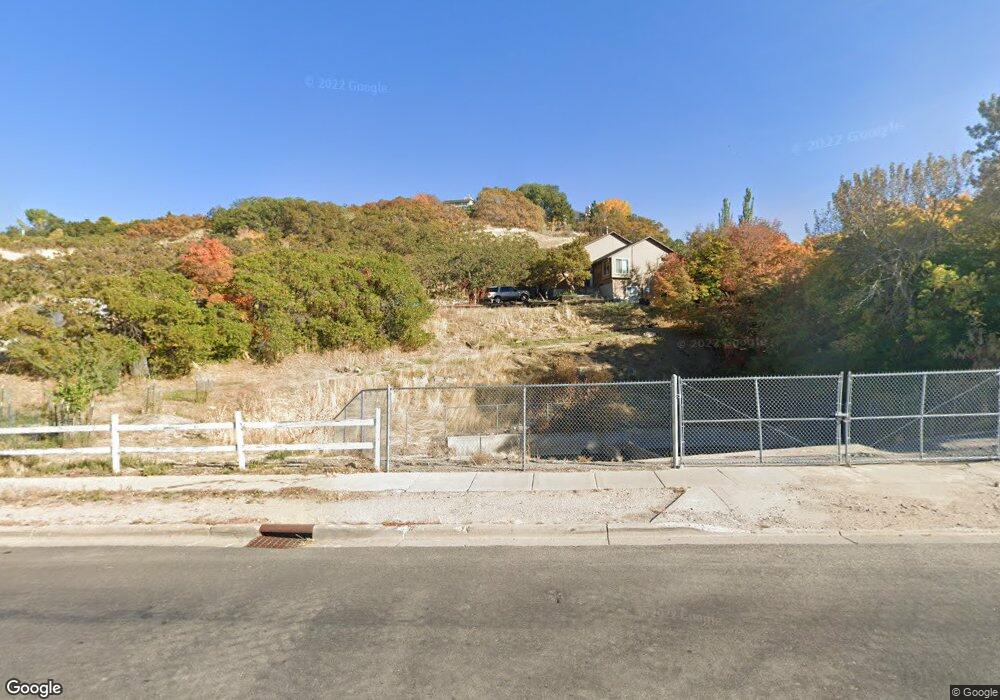
This home is located at 3045 S 400 E, Bountiful, UT 84010 and is currently estimated at $653,371, approximately $323 per square foot. 3045 S 400 E is a home located in Davis County with nearby schools including Boulton School, Mueller Park Junior High School, and Woods Cross High School.
Ownership History
Date
Name
Owned For
Owner Type
Purchase Details
Closed on
Jun 10, 2020
Sold by
Higginson Richard K and Higginson Haley N
Bought by
Spencer Jesse
Current Estimated Value
Home Financials for this Owner
Home Financials are based on the most recent Mortgage that was taken out on this home.
Original Mortgage
$371,794
Outstanding Balance
$328,838
Interest Rate
3.2%
Mortgage Type
FHA
Estimated Equity
$324,533
Purchase Details
Closed on
Oct 19, 2016
Sold by
Hager Devin
Bought by
Higginson Richard K and Higginson Haley N
Purchase Details
Closed on
Apr 25, 2016
Sold by
Truman Marketing Llc
Bought by
Hager Devin
Purchase Details
Closed on
Feb 13, 2012
Sold by
Olney Eric
Bought by
Olney Eric and Olney Nanette C
Home Financials for this Owner
Home Financials are based on the most recent Mortgage that was taken out on this home.
Original Mortgage
$188,000
Interest Rate
3.11%
Mortgage Type
New Conventional
Create a Home Valuation Report for This Property
The Home Valuation Report is an in-depth analysis detailing your home's value as well as a comparison with similar homes in the area
Purchase History
| Date | Buyer | Sale Price | Title Company |
|---|---|---|---|
| Spencer Jesse | -- | Investors Title Ins Ag | |
| Higginson Richard K | -- | Founders Title | |
| Hager Devin | -- | Founders Title | |
| Olney Eric | -- | Sutherland Title Co | |
| Olney Eric | -- | Sutherland Title Co |
Source: Public Records
Mortgage History
| Date | Status | Borrower | Loan Amount |
|---|---|---|---|
| Open | Spencer Jesse | $371,794 | |
| Previous Owner | Olney Eric | $188,000 |
Source: Public Records
Tax History
| Year | Tax Paid | Tax Assessment Tax Assessment Total Assessment is a certain percentage of the fair market value that is determined by local assessors to be the total taxable value of land and additions on the property. | Land | Improvement |
|---|---|---|---|---|
| 2025 | $3,137 | $312,400 | $216,763 | $95,637 |
| 2024 | $2,990 | $302,500 | $197,299 | $105,201 |
| 2023 | $2,863 | $524,000 | $392,593 | $131,407 |
| 2022 | $2,978 | $298,650 | $214,197 | $84,453 |
| 2021 | $2,869 | $441,000 | $321,562 | $119,438 |
| 2020 | $2,488 | $387,000 | $291,964 | $95,036 |
| 2019 | $2,476 | $376,000 | $214,912 | $161,088 |
| 2018 | $2,243 | $337,000 | $208,334 | $128,666 |
| 2016 | $1,802 | $144,045 | $131,898 | $12,147 |
| 2015 | $1,894 | $143,165 | $131,898 | $11,267 |
| 2014 | $1,743 | $134,735 | $131,898 | $2,837 |
| 2013 | -- | $129,446 | $96,462 | $32,984 |
Source: Public Records
Map
Nearby Homes
- 438 Indian Springs Rd
- 424 E Canyon Estates Dr S
- 3551 S Huntington Dr
- 610 Meadowlark Ln
- 11 E Bonneville Dr
- 3727 S 400 E
- 3716 S Oakridge Cir
- 8 E 3500 S
- 69 E North Canyon Rd
- 993 Canyon Creek Dr
- 2292 S 250 E
- 19 E North Canyon Rd
- 2273 S 200 E
- 761 San Simeon Way
- 110 2250 S
- 831 E San Simeon Way S
- 320 E 2100 S
- 2053 S 350 E Unit 7
- 337 W 2900 S
- 2046 S 350 E Unit 4
- 3089 S 400 E
- 3048 S 400 E
- 1000 E Indian Springs Rd S Unit 6
- 2993 S 400 E
- 418 Indian Springs Rd
- 309 E 3050 S
- 387 E 3100 S
- 2992 S 400 E
- 2983 S 400 E
- 411 Indian Springs Rd
- 411 Indian Springs Rd
- 3121 S 400 E
- 428 Indian Springs Rd
- 331 Lewis Park Cove
- 3068 Windsor Ln
- 289 E 3050 S
- 302 Lewis Park Cove
- 2963 S 400 E
- 2960 Foss Cir
- 3149 S 400 E
Your Personal Tour Guide
Ask me questions while you tour the home.