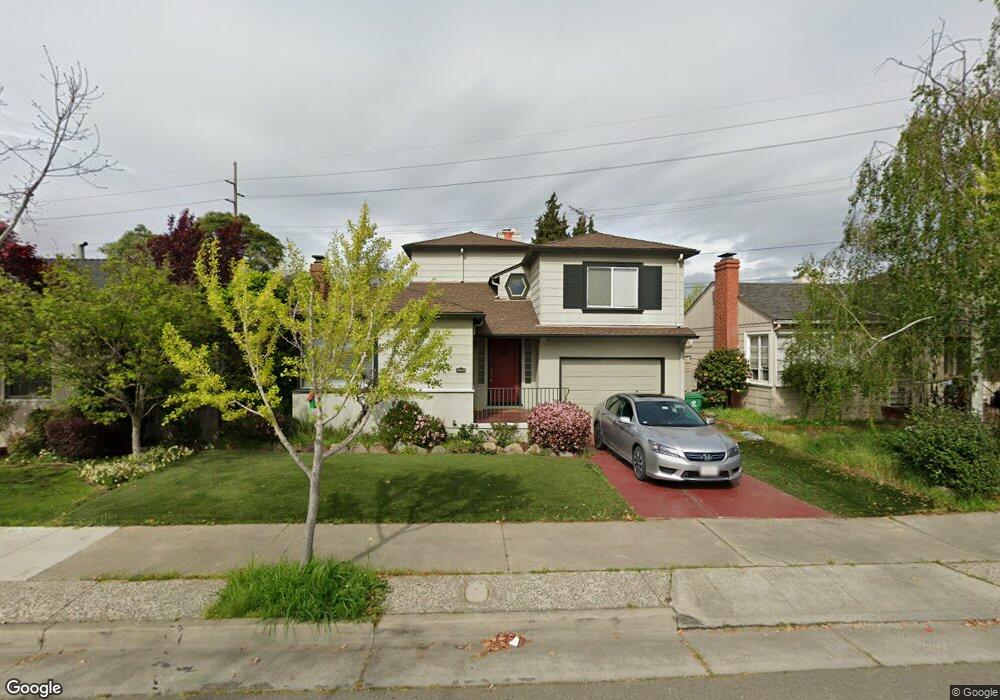
3045 Windsor Dr Alameda, CA 94501
Downtown Alameda NeighborhoodEstimated Value: $1,279,472 - $1,632,000
3
Beds
2
Baths
1,864
Sq Ft
$791/Sq Ft
Est. Value
About This Home
This home is located at 3045 Windsor Dr, Alameda, CA 94501 and is currently estimated at $1,475,118, approximately $791 per square foot. 3045 Windsor Dr is a home located in Alameda County with nearby schools including Edison Elementary School, Lincoln Middle School, and Alameda High School.
Ownership History
Date
Name
Owned For
Owner Type
Purchase Details
Closed on
Feb 6, 2021
Sold by
Ingeman John C and Ingeman Family Revocable Trust
Bought by
Fox Neal D and Fox Karin I
Current Estimated Value
Purchase Details
Closed on
Dec 13, 2016
Sold by
Leo P Hanley & Elaine M Hanley Revocable
Bought by
Fox Neal D and Fox Karin I
Purchase Details
Closed on
Jan 15, 2016
Sold by
Hanley Elaine M and Hanley Leo P
Bought by
Hanley Elaine M and Hanley Leo P
Purchase Details
Closed on
Mar 21, 2014
Sold by
Ingeman Lorraine M
Bought by
Ingeman Family Revocable Trust
Purchase Details
Closed on
May 2, 2006
Sold by
Ingeman Lorraine M and Hanley Elaine M
Bought by
Ingeman Lorraine M and Hanley Elaine M
Purchase Details
Closed on
Apr 19, 2001
Sold by
Fruzetti Elizabeth M
Bought by
Fruzetti Elizabeth M and Elizabeth M Fruzetti Revocable
Create a Home Valuation Report for This Property
The Home Valuation Report is an in-depth analysis detailing your home's value as well as a comparison with similar homes in the area
Home Values in the Area
Average Home Value in this Area
Purchase History
| Date | Buyer | Sale Price | Title Company |
|---|---|---|---|
| Fox Neal D | -- | None Available | |
| Fox Neal D | $400,000 | Fidelity National Title Co | |
| Hanley Elaine M | -- | None Available | |
| Hanley Elaine M | -- | None Available | |
| Ingeman Family Revocable Trust | -- | None Available | |
| Ingeman Lorraine M | -- | None Available | |
| Fruzetti Elizabeth M | -- | -- |
Source: Public Records
Tax History
| Year | Tax Paid | Tax Assessment Tax Assessment Total Assessment is a certain percentage of the fair market value that is determined by local assessors to be the total taxable value of land and additions on the property. | Land | Improvement |
|---|---|---|---|---|
| 2025 | $9,813 | $633,973 | $272,158 | $361,815 |
| 2024 | $9,813 | $621,546 | $266,823 | $354,723 |
| 2023 | $9,456 | $609,358 | $261,591 | $347,767 |
| 2022 | $9,254 | $597,411 | $256,462 | $340,949 |
| 2021 | $9,038 | $585,699 | $251,434 | $334,265 |
| 2020 | $8,932 | $579,696 | $248,857 | $330,839 |
| 2019 | $8,328 | $568,333 | $243,979 | $324,354 |
| 2018 | $8,126 | $557,190 | $239,196 | $317,994 |
| 2017 | $2,638 | $92,530 | $49,011 | $43,519 |
| 2016 | $2,617 | $90,715 | $48,050 | $42,665 |
| 2015 | $2,602 | $89,354 | $47,329 | $42,025 |
| 2014 | $2,537 | $87,603 | $46,402 | $41,201 |
Source: Public Records
Map
Nearby Homes
- 3024 Fernside Blvd
- 1718 High St
- 3226 Fairview Ave
- 3090 Glascock St Unit 405
- 3090 Glascock St Unit 102
- 3109 Elmwood Ave
- 827 34th Ave
- 1601 Broadway Unit 9
- 2853 Regatta Dr Unit 179
- 2875 Glascock St Unit 209
- 340 29th Ave Unit 204
- 3338 San Leandro St
- 2608 Central Ave
- 1308 Court St
- 3248 Briggs Ave
- 1321 Pearl St
- 3701 International Blvd
- 1208 31st Ave
- 1211 Court St
- 1434 40th Ave
- 3101 Windsor Dr
- 3041 Windsor Dr
- 3038 Marina Dr
- 3109 Windsor Dr
- 3032 Marina Dr
- 3045 Marina Dr
- 3035 Marina Dr
- 3042 Windsor Dr
- 3101 Marina Dr
- 3038 Windsor Dr
- 3100 Windsor Dr
- 3033 Marina Dr
- 3034 Windsor Dr
- 3105 Marina Dr
- 3104 Windsor Dr
- 3027 Windsor Dr
- 3109 Marina Dr
- 3026 Marina Dr
- 3032 Windsor Dr
- 3031 Marina Dr
Your Personal Tour Guide
Ask me questions while you tour the home.