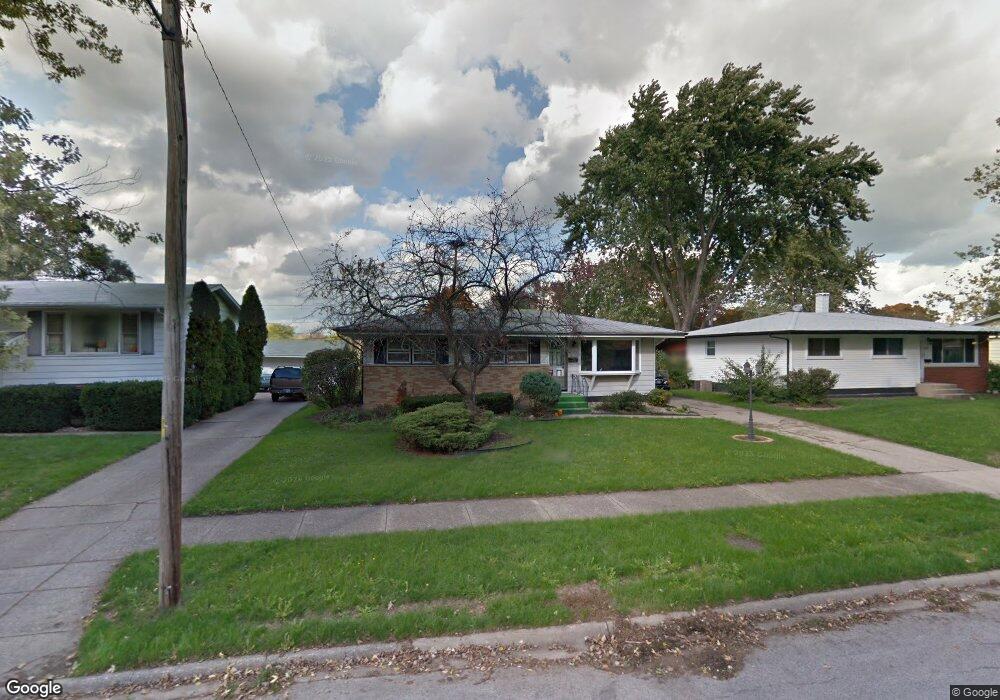
3046 188th St Lansing, IL 60438
Estimated Value: $208,000 - $216,000
3
Beds
2
Baths
1,100
Sq Ft
$192/Sq Ft
Est. Value
About This Home
This home is located at 3046 188th St, Lansing, IL 60438 and is currently estimated at $211,003, approximately $191 per square foot. 3046 188th St is a home located in Cook County with nearby schools including Nathan Hale Elementary School, Heritage Middle School, and Thornton Fractnl So High School.
Ownership History
Date
Name
Owned For
Owner Type
Purchase Details
Closed on
Mar 11, 2024
Sold by
Spagnola Bruce J
Bought by
Bruce J Spagnola Jr And Carrie A Spagnola Tru and Spagnola
Current Estimated Value
Purchase Details
Closed on
May 31, 2006
Sold by
Olsen Janet O and Spagnola Janet O
Bought by
Spagnola Bruce J
Purchase Details
Closed on
Mar 17, 2005
Sold by
Brouwer Alice A
Bought by
Spagnola Bruce J and Spagnola Janet O
Home Financials for this Owner
Home Financials are based on the most recent Mortgage that was taken out on this home.
Original Mortgage
$120,000
Interest Rate
5.64%
Mortgage Type
Unknown
Create a Home Valuation Report for This Property
The Home Valuation Report is an in-depth analysis detailing your home's value as well as a comparison with similar homes in the area
Home Values in the Area
Average Home Value in this Area
Purchase History
| Date | Buyer | Sale Price | Title Company |
|---|---|---|---|
| Bruce J Spagnola Jr And Carrie A Spagnola Tru | -- | None Listed On Document | |
| Spagnola Bruce J | -- | Chicago Title Insurance Co | |
| Spagnola Bruce J | $150,000 | Atgf Inc |
Source: Public Records
Mortgage History
| Date | Status | Borrower | Loan Amount |
|---|---|---|---|
| Previous Owner | Spagnola Bruce J | $120,000 |
Source: Public Records
Tax History Compared to Growth
Tax History
| Year | Tax Paid | Tax Assessment Tax Assessment Total Assessment is a certain percentage of the fair market value that is determined by local assessors to be the total taxable value of land and additions on the property. | Land | Improvement |
|---|---|---|---|---|
| 2024 | $5,252 | $15,628 | $3,505 | $12,123 |
| 2023 | $3,412 | $15,628 | $3,505 | $12,123 |
| 2022 | $3,412 | $9,233 | $3,092 | $6,141 |
| 2021 | $3,340 | $9,232 | $3,092 | $6,140 |
| 2020 | $3,246 | $9,232 | $3,092 | $6,140 |
| 2019 | $3,775 | $10,731 | $2,886 | $7,845 |
| 2018 | $3,669 | $10,731 | $2,886 | $7,845 |
| 2017 | $3,621 | $10,731 | $2,886 | $7,845 |
| 2016 | $4,207 | $11,275 | $2,679 | $8,596 |
| 2015 | $4,019 | $11,275 | $2,679 | $8,596 |
| 2014 | $3,951 | $11,275 | $2,679 | $8,596 |
| 2013 | $4,192 | $12,812 | $2,679 | $10,133 |
Source: Public Records
Map
Nearby Homes
- 18828 Greenbay Ave
- 2950 188th Place
- 18905 Park Ave
- 18864 Greenbay Ave
- 3034 190th St
- 18855 Burnham Ave Unit 234
- 18855 Burnham Ave Unit 132
- 18855 Burnham Ave Unit 231
- 3109 190th St Unit 2
- 18602 Chicago Ave
- 3240 N Manor Dr Unit 130
- 3225 Otto St
- 2934 186th St
- 2958 191st St
- 18964 Wildwood Ave
- 18514 Ridgewood Ave
- 3363 S Manor Dr
- 2838 191st Place
- 3320 191st St
- 2849 191st Place
- 3038 188th St
- 3052 188th St Unit 3
- 3032 188th St
- 3058 188th St
- 3026 188th St Unit 3
- 3051 188th St
- 3064 188th St
- 18824 Cherry Ln
- 3059 188th St
- 3020 188th St
- 3027 188th St
- 3106 188th St
- 18831 Cherry Ln
- 18830 Cherry Ln
- 18832 Cherry Ln
- 3101 188th St
- 18823 Park Ave
- 3112 188th St
- 3014 188th St Unit 3
- 18839 Cherry Ln