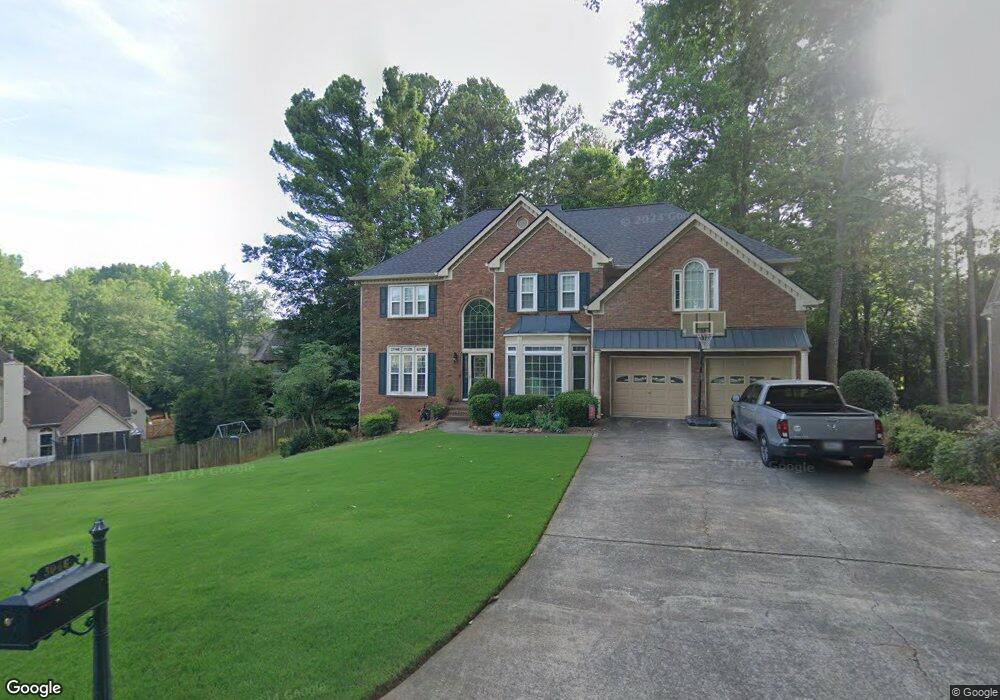
3046 Sawyer Trace NE Unit 9 Marietta, GA 30066
Sandy Plains NeighborhoodEstimated Value: $787,915 - $901,000
5
Beds
3
Baths
3,456
Sq Ft
$242/Sq Ft
Est. Value
About This Home
This home is located at 3046 Sawyer Trace NE Unit 9, Marietta, GA 30066 and is currently estimated at $834,979, approximately $241 per square foot. 3046 Sawyer Trace NE Unit 9 is a home located in Cobb County with nearby schools including Davis Elementary School, Mabry Middle School, and Lassiter High School.
Ownership History
Date
Name
Owned For
Owner Type
Purchase Details
Closed on
Jun 15, 2007
Sold by
Solan Lisa B
Bought by
Ofallon Brian and Ofallon Laurie
Current Estimated Value
Purchase Details
Closed on
Feb 7, 2002
Sold by
Solan Lisa and Solan John J
Bought by
Solan Lisa B
Home Financials for this Owner
Home Financials are based on the most recent Mortgage that was taken out on this home.
Original Mortgage
$215,000
Interest Rate
7.12%
Mortgage Type
New Conventional
Purchase Details
Closed on
May 8, 1998
Sold by
Reid Thomas A and Reid Dorothy J
Bought by
Sloan Lisa
Create a Home Valuation Report for This Property
The Home Valuation Report is an in-depth analysis detailing your home's value as well as a comparison with similar homes in the area
Home Values in the Area
Average Home Value in this Area
Purchase History
| Date | Buyer | Sale Price | Title Company |
|---|---|---|---|
| Ofallon Brian | $418,000 | -- | |
| Solan Lisa B | -- | -- | |
| Sloan Lisa | $245,000 | -- |
Source: Public Records
Mortgage History
| Date | Status | Borrower | Loan Amount |
|---|---|---|---|
| Previous Owner | Solan Lisa B | $215,000 | |
| Closed | Sloan Lisa | -- |
Source: Public Records
Tax History Compared to Growth
Tax History
| Year | Tax Paid | Tax Assessment Tax Assessment Total Assessment is a certain percentage of the fair market value that is determined by local assessors to be the total taxable value of land and additions on the property. | Land | Improvement |
|---|---|---|---|---|
| 2025 | $1,869 | $267,816 | $64,000 | $203,816 |
| 2024 | $1,875 | $267,816 | $64,000 | $203,816 |
| 2023 | $1,634 | $256,304 | $50,000 | $206,304 |
| 2022 | $1,709 | $212,480 | $44,000 | $168,480 |
| 2021 | $1,624 | $184,004 | $40,800 | $143,204 |
| 2020 | $1,624 | $184,004 | $40,800 | $143,204 |
| 2019 | $1,575 | $167,624 | $38,000 | $129,624 |
| 2018 | $1,575 | $167,624 | $38,000 | $129,624 |
| 2017 | $1,376 | $167,624 | $38,000 | $129,624 |
| 2016 | $1,314 | $146,800 | $36,000 | $110,800 |
| 2015 | $3,994 | $146,800 | $36,000 | $110,800 |
| 2014 | $3,548 | $128,248 | $0 | $0 |
Source: Public Records
Map
Nearby Homes
- 3043 Sawyer Trace NE
- 2855 Lamer Trace
- 4397 Windsor Oaks Cir
- 4563 Ashmore Cir NE
- 4464 Windsor Oaks Dr
- 3333 Devaughn Dr NE
- 2713 Arbor Summit
- 4589 Wigley Estates Rd
- 4259 Arbor Club Dr
- 2842 Forest Chase Dr NE
- 4302 Highborne Dr NE Unit 3
- 2958 Forest Chase Terrace NE
- 2696 S Arbor Dr
- 3130 Maley Ct
- 4219 N Mountain Rd NE
- 4243 N Mountain Rd NE
- 3350 Brookhill Cir
- 3901 Hazelhurst Dr
- 3798 Upland Dr
- 2610 Chadwick Rd
- 3044 Sawyer Trace NE
- 3067 Hillside Trail NE Unit 9
- 3069 Hillside Trail NE
- 3065 Hillside Trail NE Unit 9
- 3048 Sawyer Trace NE
- 4472 Windsor Oaks Cir
- 3045 Sawyer Trace NE
- 3042 Sawyer Trace NE
- 4470 Windsor Oaks Cir
- 0 Sawyer Trace NE Unit 8859283
- 3040 Sawyer Trace NE
- 3063 Hillside Trail NE Unit 9
- 0 Hillside Trail Unit 7475850
- 3047 Sawyer Trace NE
- 3049 Sawyer Trace NE
- 3050 Sawyer Trace NE
- 4466 Windsor Oaks Cir
- 3068 Hillside Trail NE
- 3154 Sawyer Ct NE
- 3070 Hillside Trail NE