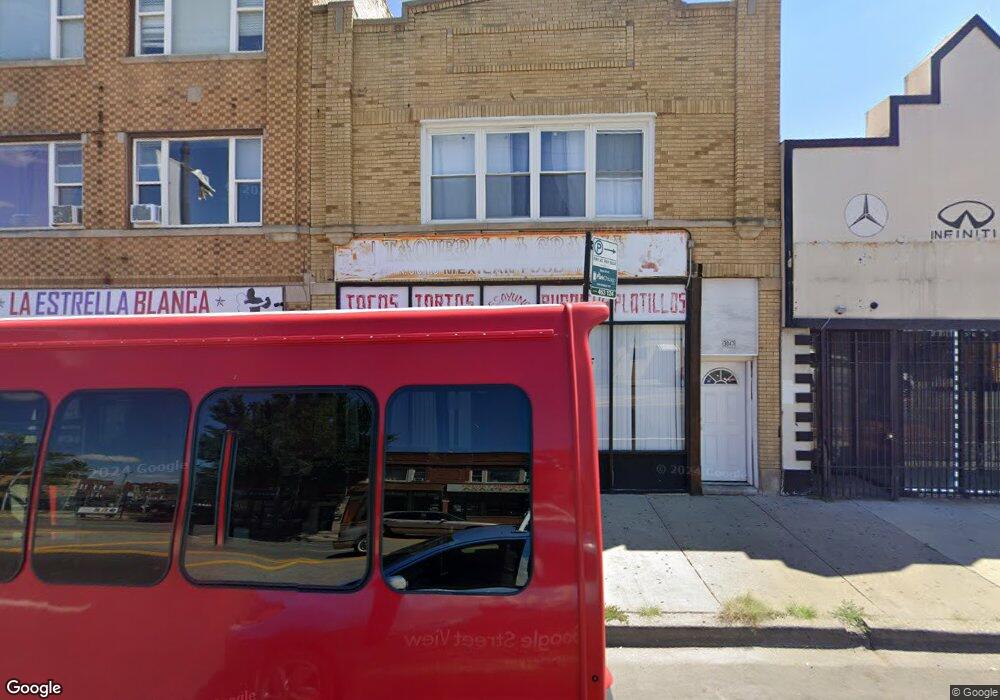
3047 N Cicero Ave Unit 1 Chicago, IL 60641
Cragin NeighborhoodEstimated Value: $349,161 - $542,000
3
Beds
1
Bath
1,400
Sq Ft
$326/Sq Ft
Est. Value
About This Home
This home is located at 3047 N Cicero Ave Unit 1, Chicago, IL 60641 and is currently estimated at $455,720, approximately $325 per square foot. 3047 N Cicero Ave Unit 1 is a home located in Cook County with nearby schools including Falconer Elementary School, Foreman College and Career Academy, and Kelvyn Park High School.
Ownership History
Date
Name
Owned For
Owner Type
Purchase Details
Closed on
Jun 29, 2020
Sold by
Mlcrgc Properties Llc
Bought by
3047Cicero Llc
Current Estimated Value
Home Financials for this Owner
Home Financials are based on the most recent Mortgage that was taken out on this home.
Original Mortgage
$189,000
Interest Rate
2.9%
Mortgage Type
Commercial
Purchase Details
Closed on
Oct 4, 2011
Sold by
Cantrell Rodney
Bought by
Mlcrgc Properties Llc
Purchase Details
Closed on
Nov 30, 2010
Sold by
Clb Lots Llc
Bought by
Cantrell Rodney
Purchase Details
Closed on
Nov 2, 2010
Sold by
Vazquez Abimael
Bought by
Clb Lots Llc
Purchase Details
Closed on
Dec 30, 2004
Sold by
Anzalone John
Bought by
Vazquez Abimael and Vazquez Flora
Home Financials for this Owner
Home Financials are based on the most recent Mortgage that was taken out on this home.
Original Mortgage
$307,500
Interest Rate
6.25%
Mortgage Type
Commercial
Create a Home Valuation Report for This Property
The Home Valuation Report is an in-depth analysis detailing your home's value as well as a comparison with similar homes in the area
Home Values in the Area
Average Home Value in this Area
Purchase History
| Date | Buyer | Sale Price | Title Company |
|---|---|---|---|
| 3047Cicero Llc | $270,000 | Attorney | |
| Mlcrgc Properties Llc | -- | None Available | |
| Cantrell Rodney | $175,000 | Cti | |
| Clb Lots Llc | -- | None Available | |
| Vazquez Abimael | $410,000 | Multiple |
Source: Public Records
Mortgage History
| Date | Status | Borrower | Loan Amount |
|---|---|---|---|
| Previous Owner | 3047Cicero Llc | $189,000 | |
| Previous Owner | Vazquez Abimael | $307,500 |
Source: Public Records
Tax History
| Year | Tax Paid | Tax Assessment Tax Assessment Total Assessment is a certain percentage of the fair market value that is determined by local assessors to be the total taxable value of land and additions on the property. | Land | Improvement |
|---|---|---|---|---|
| 2025 | $3,798 | $33,000 | $9,610 | $23,390 |
| 2024 | $3,798 | $33,000 | $9,610 | $23,390 |
| 2023 | $3,703 | $18,000 | $7,750 | $10,250 |
| 2022 | $3,703 | $18,000 | $7,750 | $10,250 |
| 2021 | $3,620 | $18,003 | $7,753 | $10,250 |
| 2020 | $3,404 | $18,383 | $4,495 | $13,888 |
| 2019 | $3,606 | $21,376 | $4,495 | $16,881 |
| 2018 | $3,544 | $21,376 | $4,495 | $16,881 |
| 2017 | $5,013 | $26,663 | $4,030 | $22,633 |
| 2016 | $4,840 | $26,663 | $4,030 | $22,633 |
| 2015 | $4,405 | $26,663 | $4,030 | $22,633 |
| 2014 | $4,542 | $27,048 | $3,720 | $23,328 |
| 2013 | $4,441 | $27,048 | $3,720 | $23,328 |
Source: Public Records
Map
Nearby Homes
- 3044 N Kolmar Ave
- 4755 W Diversey Ave
- 4834 W Henderson St Unit 1B
- 4817 W Parker Ave
- 3406 N Keating Ave
- 4629 W Parker Ave
- 3204 N Kostner Ave Unit 204
- 3204 N Kostner Ave Unit 303
- 3204 N Kostner Ave Unit 205
- 3204 N Kostner Ave Unit 307
- 3204 N Kostner Ave Unit 506
- 3204 N Kostner Ave Unit 406
- 3204 N Kostner Ave Unit 306
- 3415 N Kenton Ave
- 4814 W Drummond Place
- 2950 N Lowell Ave
- 4912 W Drummond Place
- 4350 W Belmont Ave
- 3469 N Keating Ave
- 2849 N Kostner Ave
- 3047 N Cicero Ave
- 3049 N Cicero Ave
- 3041 N Cicero Ave
- 3037 N Cicero Ave
- 3048 N Keating Ave
- 3048 N Keating Ave
- 3046 N Keating Ave
- 3046 N Keating Ave Unit 1
- 3046 N Keating Ave
- 3042 N Keating Ave
- 3040 N Cicero Ave
- 3040 N Cicero Ave Unit 2
- 3040 N Cicero Ave Unit 1
- 3036 N Keating Ave Unit 2
- 3036 N Keating Ave
- 3040 N Keating Ave
- 3040 N Keating Ave Unit 2
- 3052 N Keating Ave
- 3052 N Keating Ave Unit M
- 3054 N Keating Ave
Your Personal Tour Guide
Ask me questions while you tour the home.