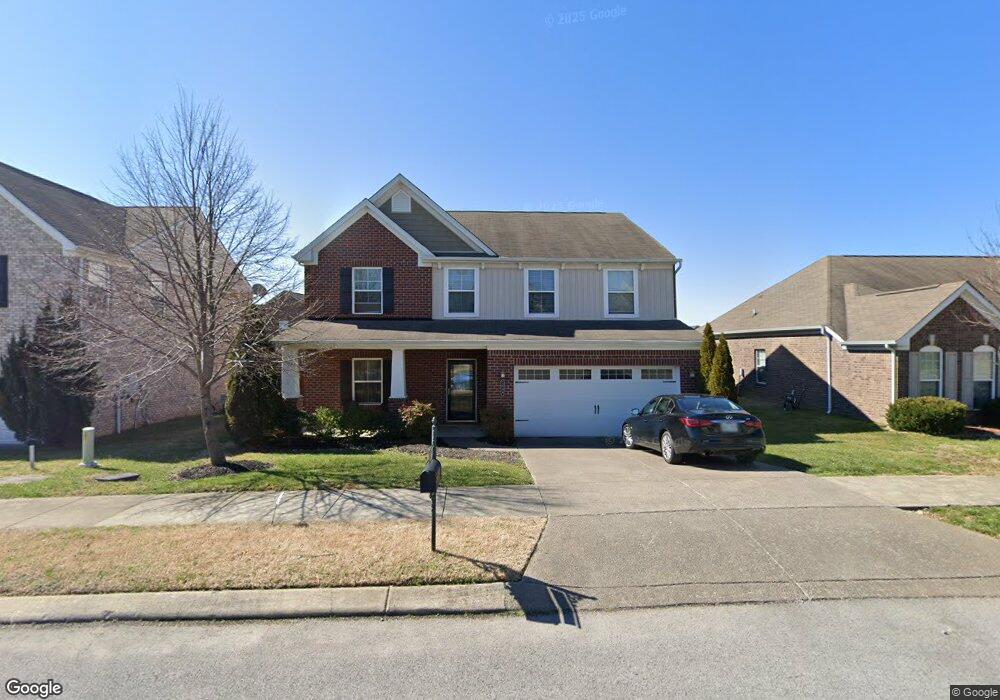
3048 Canal St Nolensville, TN 37135
Estimated Value: $688,000 - $767,000
4
Beds
3
Baths
3,199
Sq Ft
$231/Sq Ft
Est. Value
About This Home
This home is located at 3048 Canal St, Nolensville, TN 37135 and is currently estimated at $739,830, approximately $231 per square foot. 3048 Canal St is a home located in Williamson County with nearby schools including Nolensville Elementary School, Mill Creek Middle School, and Nolensville High School.
Ownership History
Date
Name
Owned For
Owner Type
Purchase Details
Closed on
Sep 20, 2024
Sold by
Price George Myron and Charishma Deadm
Bought by
Price George Myron and Price Charishma Deadmon
Current Estimated Value
Home Financials for this Owner
Home Financials are based on the most recent Mortgage that was taken out on this home.
Original Mortgage
$50,000
Outstanding Balance
$49,392
Interest Rate
6.49%
Mortgage Type
New Conventional
Estimated Equity
$690,438
Purchase Details
Closed on
Jun 18, 2010
Sold by
Nvr Inc
Bought by
Price George M and Price Charishma D
Home Financials for this Owner
Home Financials are based on the most recent Mortgage that was taken out on this home.
Original Mortgage
$259,418
Interest Rate
5.25%
Mortgage Type
FHA
Purchase Details
Closed on
Apr 12, 2010
Sold by
Moon Thomas W
Bought by
Nvr Inc and Fox Ridge Homes
Create a Home Valuation Report for This Property
The Home Valuation Report is an in-depth analysis detailing your home's value as well as a comparison with similar homes in the area
Home Values in the Area
Average Home Value in this Area
Purchase History
| Date | Buyer | Sale Price | Title Company |
|---|---|---|---|
| Price George Myron | -- | Clearedge Title | |
| Price George M | $264,205 | None Available | |
| Nvr Inc | $63,000 | None Available |
Source: Public Records
Mortgage History
| Date | Status | Borrower | Loan Amount |
|---|---|---|---|
| Open | Price George Myron | $50,000 | |
| Previous Owner | Price George M | $259,418 |
Source: Public Records
Tax History Compared to Growth
Tax History
| Year | Tax Paid | Tax Assessment Tax Assessment Total Assessment is a certain percentage of the fair market value that is determined by local assessors to be the total taxable value of land and additions on the property. | Land | Improvement |
|---|---|---|---|---|
| 2025 | $2,129 | $178,825 | $43,750 | $135,075 |
| 2024 | $2,129 | $113,225 | $22,500 | $90,725 |
| 2023 | $2,129 | $113,225 | $22,500 | $90,725 |
| 2022 | $2,129 | $113,225 | $22,500 | $90,725 |
| 2021 | $2,129 | $113,225 | $22,500 | $90,725 |
| 2020 | $1,829 | $82,375 | $18,750 | $63,625 |
| 2019 | $1,829 | $82,375 | $18,750 | $63,625 |
| 2018 | $1,771 | $82,375 | $18,750 | $63,625 |
| 2017 | $1,771 | $82,375 | $18,750 | $63,625 |
| 2016 | $0 | $82,375 | $18,750 | $63,625 |
| 2015 | -- | $65,750 | $16,250 | $49,500 |
| 2014 | -- | $65,750 | $16,250 | $49,500 |
Source: Public Records
Map
Nearby Homes
- 3009 Canal St
- 842 Nolenmeade Place
- 1114 Crossfield Dr
- 3104 Rutgers Pass
- 2239 Dominick Dr
- 2553 Carmine St
- 0 Rocky Fork Rd
- 1005 Kirkpark Ct
- 3136 Bradfield Dr
- 1048 Annecy Pkwy
- Adriana Plan at Annecy
- Harland Plan at Annecy
- Milan Plan at Annecy
- 3540 Josephine Way
- 2195 Broadway St
- 2677 York Rd
- 1053 Annecy Pkwy
- 4601 Robin Ln
- 2194 Broadway St
- 1049 Annecy Pkwy