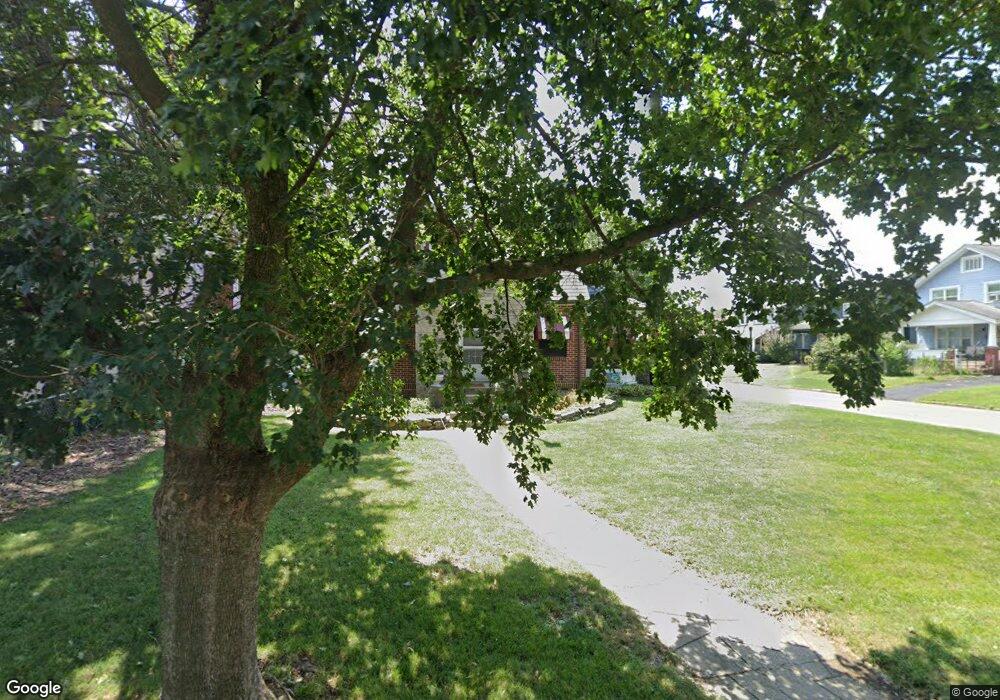
3049 Olive St Columbus, OH 43204
Westgate NeighborhoodEstimated Value: $289,000 - $339,000
3
Beds
2
Baths
1,482
Sq Ft
$213/Sq Ft
Est. Value
About This Home
This home is located at 3049 Olive St, Columbus, OH 43204 and is currently estimated at $315,998, approximately $213 per square foot. 3049 Olive St is a home located in Franklin County with nearby schools including Westgate Alternative Elementary School, Westmoor Middle School, and West High School.
Ownership History
Date
Name
Owned For
Owner Type
Purchase Details
Closed on
May 24, 2004
Sold by
Rubin William V
Bought by
Rubin William V and Ossa Janice E
Current Estimated Value
Home Financials for this Owner
Home Financials are based on the most recent Mortgage that was taken out on this home.
Original Mortgage
$122,500
Interest Rate
5.99%
Mortgage Type
Purchase Money Mortgage
Purchase Details
Closed on
Nov 29, 2001
Sold by
Charnier Robert G
Bought by
Rubin William V
Home Financials for this Owner
Home Financials are based on the most recent Mortgage that was taken out on this home.
Original Mortgage
$121,500
Interest Rate
6.68%
Purchase Details
Closed on
Nov 19, 2001
Sold by
Estate Of Robert G Charnier
Bought by
Charnier Virginia
Home Financials for this Owner
Home Financials are based on the most recent Mortgage that was taken out on this home.
Original Mortgage
$121,500
Interest Rate
6.68%
Purchase Details
Closed on
Aug 20, 1997
Sold by
Thompsons Frances I
Bought by
Charnier Robert G
Create a Home Valuation Report for This Property
The Home Valuation Report is an in-depth analysis detailing your home's value as well as a comparison with similar homes in the area
Home Values in the Area
Average Home Value in this Area
Purchase History
| Date | Buyer | Sale Price | Title Company |
|---|---|---|---|
| Rubin William V | -- | Chicago Title | |
| Rubin William V | $127,900 | The Title Firm | |
| Charnier Virginia | -- | -- | |
| Charnier Robert G | -- | -- |
Source: Public Records
Mortgage History
| Date | Status | Borrower | Loan Amount |
|---|---|---|---|
| Closed | Rubin William V | $122,500 | |
| Closed | Rubin William V | $121,500 |
Source: Public Records
Tax History Compared to Growth
Tax History
| Year | Tax Paid | Tax Assessment Tax Assessment Total Assessment is a certain percentage of the fair market value that is determined by local assessors to be the total taxable value of land and additions on the property. | Land | Improvement |
|---|---|---|---|---|
| 2024 | $3,772 | $93,840 | $23,210 | $70,630 |
| 2023 | $3,751 | $93,835 | $23,205 | $70,630 |
| 2022 | $3,197 | $70,390 | $9,350 | $61,040 |
| 2021 | $3,203 | $70,390 | $9,350 | $61,040 |
| 2020 | $3,207 | $70,390 | $9,350 | $61,040 |
| 2019 | $3,002 | $58,240 | $7,770 | $50,470 |
| 2018 | $2,455 | $51,140 | $7,770 | $43,370 |
| 2017 | $2,576 | $51,140 | $7,770 | $43,370 |
| 2016 | $2,583 | $47,740 | $11,970 | $35,770 |
| 2015 | $2,345 | $47,740 | $11,970 | $35,770 |
| 2014 | $2,350 | $47,740 | $11,970 | $35,770 |
| 2013 | $1,159 | $47,740 | $11,970 | $35,770 |
Source: Public Records
Map
Nearby Homes
- 58 Binns Blvd
- 3096 Ellis Place
- 133 S Brinker Ave
- 267 S Westgate Ave
- 0 S Brinker Ave
- 261 S Chase Ave
- 75 N Huron Ave
- 32 Orel Ave
- 66 N Brinker Ave
- 36-38 Orel Ave
- 253 Powhatan Ave
- 327 S Chase Ave
- 65 N Chase Ave
- 65 S Hague Ave
- 195 S Sylvan Ave
- 2845 Fremont St
- 227 S Hague Ave
- 363 S Chase Ave
- 119 N Westgate Ave
- 339 S Powell Ave
- 3043 Olive St
- 3037 Olive St
- 3033 Olive St
- 142 S Westmoor Ave
- 121 N Westmoor Ave Unit 123
- 127 S Westmoor Ave
- 121 S Westmoor Ave
- 133 S Westmoor Ave
- 3027 Olive St
- 139 S Westmoor Ave
- 150 S Westmoor Ave
- 104 S Westmoor Ave
- 3044 Olive St
- 3040 Olive St
- 143 S Westmoor Ave
- 107 S Westmoor Ave
- 3034 Olive St
- 143 S Huron Ave
- 133 S Huron Ave