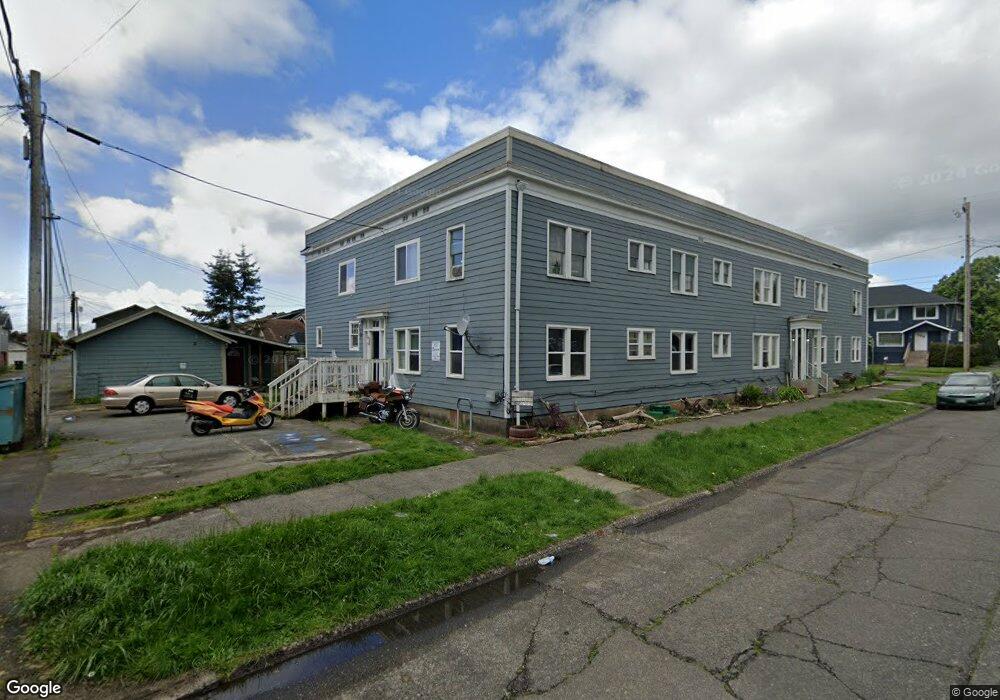
305 1/2 W 3rd St Aberdeen, WA 98520
Estimated Value: $257,000 - $304,000
2
Beds
1
Bath
2,194
Sq Ft
$127/Sq Ft
Est. Value
About This Home
This home is located at 305 1/2 W 3rd St, Aberdeen, WA 98520 and is currently estimated at $279,650, approximately $127 per square foot. 305 1/2 W 3rd St is a home located in Grays Harbor County with nearby schools including McDermoth Elementary School, Miller Junior High School, and J.M. Weatherwax High School.
Ownership History
Date
Name
Owned For
Owner Type
Purchase Details
Closed on
Dec 14, 2022
Sold by
Andrews Jason and Andrews Eloise
Bought by
Jnl Property Holdings Llc
Current Estimated Value
Purchase Details
Closed on
Dec 28, 2020
Sold by
Mclean Joshua and Bartlett Jessica
Bought by
Andrews Eloise G and Andrews Jason
Home Financials for this Owner
Home Financials are based on the most recent Mortgage that was taken out on this home.
Original Mortgage
$142,100
Interest Rate
2.7%
Mortgage Type
New Conventional
Purchase Details
Closed on
Mar 30, 2017
Sold by
Miller Gregg R
Bought by
Mclean Joshua and Bartlett Jessica
Home Financials for this Owner
Home Financials are based on the most recent Mortgage that was taken out on this home.
Original Mortgage
$110,000
Interest Rate
4.15%
Mortgage Type
New Conventional
Purchase Details
Closed on
Aug 17, 2016
Sold by
Miller Brett
Bought by
Miller Gregg R
Create a Home Valuation Report for This Property
The Home Valuation Report is an in-depth analysis detailing your home's value as well as a comparison with similar homes in the area
Home Values in the Area
Average Home Value in this Area
Purchase History
| Date | Buyer | Sale Price | Title Company |
|---|---|---|---|
| Jnl Property Holdings Llc | -- | -- | |
| Andrews Eloise G | $203,000 | Pacific Title | |
| Mclean Joshua | $100,000 | Ght | |
| Miller Gregg R | -- | None Available |
Source: Public Records
Mortgage History
| Date | Status | Borrower | Loan Amount |
|---|---|---|---|
| Previous Owner | Andrews Eloise G | $142,100 | |
| Previous Owner | Mclean Joshua | $110,000 |
Source: Public Records
Tax History Compared to Growth
Tax History
| Year | Tax Paid | Tax Assessment Tax Assessment Total Assessment is a certain percentage of the fair market value that is determined by local assessors to be the total taxable value of land and additions on the property. | Land | Improvement |
|---|---|---|---|---|
| 2025 | $2,513 | $262,350 | $21,336 | $241,014 |
| 2023 | $2,392 | $276,647 | $21,336 | $255,311 |
| 2022 | $2,130 | $182,740 | $20,313 | $162,427 |
| 2021 | $1,625 | $182,740 | $20,313 | $162,427 |
| 2020 | $1,571 | $126,627 | $16,250 | $110,377 |
| 2019 | $1,200 | $121,371 | $16,250 | $105,121 |
| 2018 | $1,274 | $97,489 | $16,250 | $81,239 |
| 2017 | $1,181 | $80,274 | $16,250 | $64,024 |
| 2016 | $1,171 | $77,225 | $16,250 | $60,975 |
| 2014 | -- | $75,800 | $16,250 | $59,550 |
| 2013 | -- | $81,835 | $16,250 | $65,585 |
Source: Public Records
Map
Nearby Homes