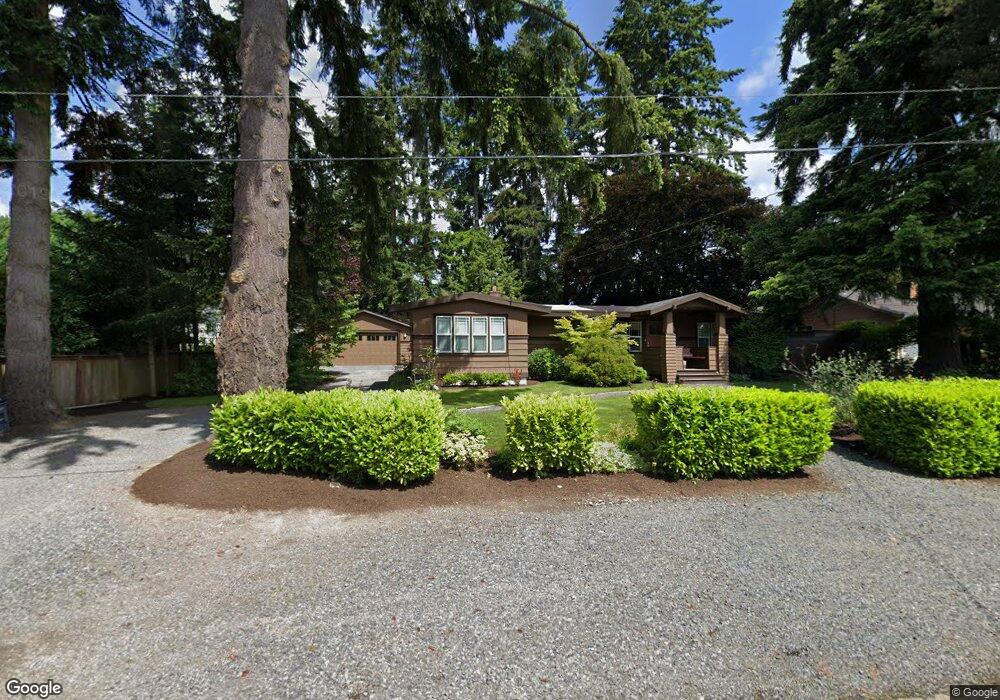
305 241st St SW Bothell, WA 98021
Queensborough-Brentwood NeighborhoodEstimated Value: $882,268 - $1,117,000
3
Beds
1
Bath
1,152
Sq Ft
$826/Sq Ft
Est. Value
About This Home
This home is located at 305 241st St SW, Bothell, WA 98021 and is currently estimated at $951,567, approximately $826 per square foot. 305 241st St SW is a home located in Snohomish County with nearby schools including Shelton View Elementary School, Canyon Park Junior High School, and Bothell High School.
Ownership History
Date
Name
Owned For
Owner Type
Purchase Details
Closed on
Oct 31, 2024
Sold by
Lansing Amy Elizabeth
Bought by
Lansing Living Trust and Lansing
Current Estimated Value
Purchase Details
Closed on
Aug 11, 2011
Sold by
Lansing Doug
Bought by
Lansing Amy
Home Financials for this Owner
Home Financials are based on the most recent Mortgage that was taken out on this home.
Original Mortgage
$179,440
Interest Rate
4.43%
Mortgage Type
New Conventional
Purchase Details
Closed on
Aug 8, 2011
Sold by
Pountain Jeffrey J and Pountain Mark C
Bought by
Lansing Amy
Home Financials for this Owner
Home Financials are based on the most recent Mortgage that was taken out on this home.
Original Mortgage
$179,440
Interest Rate
4.43%
Mortgage Type
New Conventional
Purchase Details
Closed on
Nov 22, 2010
Sold by
Talbot Penny 6 and Pountain Mark C
Bought by
Pountain Marcella I
Purchase Details
Closed on
Nov 20, 2008
Sold by
Pountain Marcella I
Bought by
Talbot Penny L and Pountain Mark C
Create a Home Valuation Report for This Property
The Home Valuation Report is an in-depth analysis detailing your home's value as well as a comparison with similar homes in the area
Home Values in the Area
Average Home Value in this Area
Purchase History
| Date | Buyer | Sale Price | Title Company |
|---|---|---|---|
| Lansing Living Trust | $313 | None Listed On Document | |
| Lansing Amy | -- | Rainier Title Llc | |
| Lansing Amy | $224,300 | Rainier Title Llc | |
| Pountain Marcella I | -- | None Available | |
| Talbot Penny L | -- | None Available |
Source: Public Records
Mortgage History
| Date | Status | Borrower | Loan Amount |
|---|---|---|---|
| Previous Owner | Lansing Amy | $179,440 | |
| Previous Owner | Lansing Amy | $179,440 |
Source: Public Records
Tax History Compared to Growth
Tax History
| Year | Tax Paid | Tax Assessment Tax Assessment Total Assessment is a certain percentage of the fair market value that is determined by local assessors to be the total taxable value of land and additions on the property. | Land | Improvement |
|---|---|---|---|---|
| 2025 | $6,552 | $862,100 | $575,000 | $287,100 |
| 2024 | $6,552 | $772,100 | $485,000 | $287,100 |
| 2023 | $7,003 | $903,500 | $615,000 | $288,500 |
| 2022 | $6,280 | $653,300 | $405,000 | $248,300 |
| 2020 | $5,703 | $549,900 | $335,000 | $214,900 |
| 2019 | $4,954 | $493,800 | $280,000 | $213,800 |
| 2018 | $4,471 | $477,100 | $280,000 | $197,100 |
| 2017 | $3,773 | $364,500 | $195,000 | $169,500 |
| 2016 | $3,349 | $333,300 | $170,000 | $163,300 |
| 2015 | $2,468 | $229,100 | $150,000 | $79,100 |
| 2013 | $2,355 | $192,800 | $122,000 | $70,800 |
Source: Public Records
Map
Nearby Homes
- 201 240th St SW
- 24123 7th Ave W
- 7621 NE 205th St
- 722 Wandering Creek Dr
- 20343 75th Ave NE
- 23916 7th Place W
- 23621 7th Ave W
- 7512 NE 202nd Place
- 20219 75th Ave NE
- 23723 9th Place W
- 16 234th Place SE
- 20103 75th Ave NE
- 23318 3rd Place W
- 24004 10th Place W
- 19821 75th Ave NE
- 1121 244th St SW Unit 44
- 1121 244th St SW Unit 19
- 1121 244th St SW Unit 66
- 23404 8th Place W
- 509 237th Place SE Unit D
- 225 241st St SW
- 320 240th St SW
- 310 240th St SW
- 224 240th St SW
- 24105 3rd Place W
- 224 241st St SW
- 215 241st St SW
- 216 240th St SW
- 24119 3rd Place W
- 24118 2nd Place W
- 24100 3rd Place W
- 205 241st St SW
- 24101 2nd Place W
- 24110 3rd Place W
- 328 240th St SW
- 309 240th St SW
- 24123 3rd Place W
- 206 240th St SW
- 24120 2nd Place W
- 24111 2nd Place W