A
Seller's Agent in 2015
Agent Out of Area
Out of Area Office
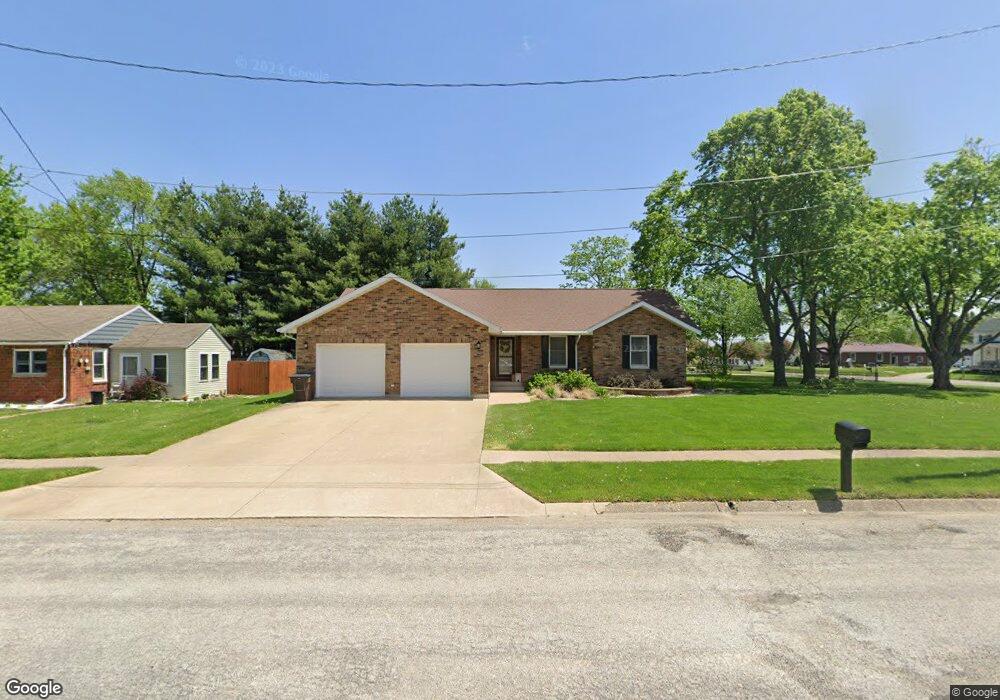
Estimated Value: $230,000 - $273,000
FSBO--ONE TIME SHOWING
Last Agent to Sell the Property
Agent Out of Area
Out of Area Office Listed on: 03/02/2015
| Date | Buyer | Sale Price | Title Company |
|---|---|---|---|
| Nelson Matthew D | $3,320 | None Listed On Document |
| Date | Status | Borrower | Loan Amount |
|---|---|---|---|
| Open | Nelson Matthew D | $225,600 |
| Date | Event | Price | List to Sale | Price per Sq Ft |
|---|---|---|---|---|
| 04/15/2015 04/15/15 | Sold | $162,500 | -1.5% | $103 / Sq Ft |
| 04/01/2015 04/01/15 | Pending | -- | -- | -- |
| 03/02/2015 03/02/15 | For Sale | $165,000 | -- | $105 / Sq Ft |
| Year | Tax Paid | Tax Assessment Tax Assessment Total Assessment is a certain percentage of the fair market value that is determined by local assessors to be the total taxable value of land and additions on the property. | Land | Improvement |
|---|---|---|---|---|
| 2024 | $3,718 | $219,410 | $14,250 | $205,160 |
| 2023 | $3,526 | $219,410 | $14,250 | $205,160 |
| 2022 | $2,486 | $165,670 | $14,250 | $151,420 |
| 2021 | $2,486 | $165,670 | $14,250 | $151,420 |
| 2020 | $2,572 | $162,310 | $15,110 | $147,200 |
| 2019 | $2,446 | $162,310 | $15,110 | $147,200 |
| 2018 | $2,520 | $153,120 | $0 | $0 |
| 2017 | $2,576 | $153,120 | $0 | $0 |
| 2016 | $2,558 | $153,120 | $0 | $0 |
| 2015 | $2,558 | $153,120 | $0 | $0 |
| 2014 | $2,398 | $153,120 | $0 | $0 |
A
Seller's Agent in 2015
Agent Out of Area
Out of Area Office
Source: NoCoast MLS
MLS Number: NOC5382057
APN: 02-43-08-04-307-0040
Disclaimer: Certain information contained herein is derived from information provided by parties other than Homes.com. All information provided is deemed reliable, but is not guaranteed to be accurate and should be independently verified.
![]() IDX information is provided exclusively for personal, non-commercial use, and may not be used for any purpose other than to identify prospective properties consumers may be interested in purchasing.
IDX information is provided exclusively for personal, non-commercial use, and may not be used for any purpose other than to identify prospective properties consumers may be interested in purchasing.
Information is deemed reliable but not guaranteed.