305 Canterbury Way Unit 3 Oxnard, CA 93033
South Winds NeighborhoodEstimated Value: $485,000 - $508,000
About This Home
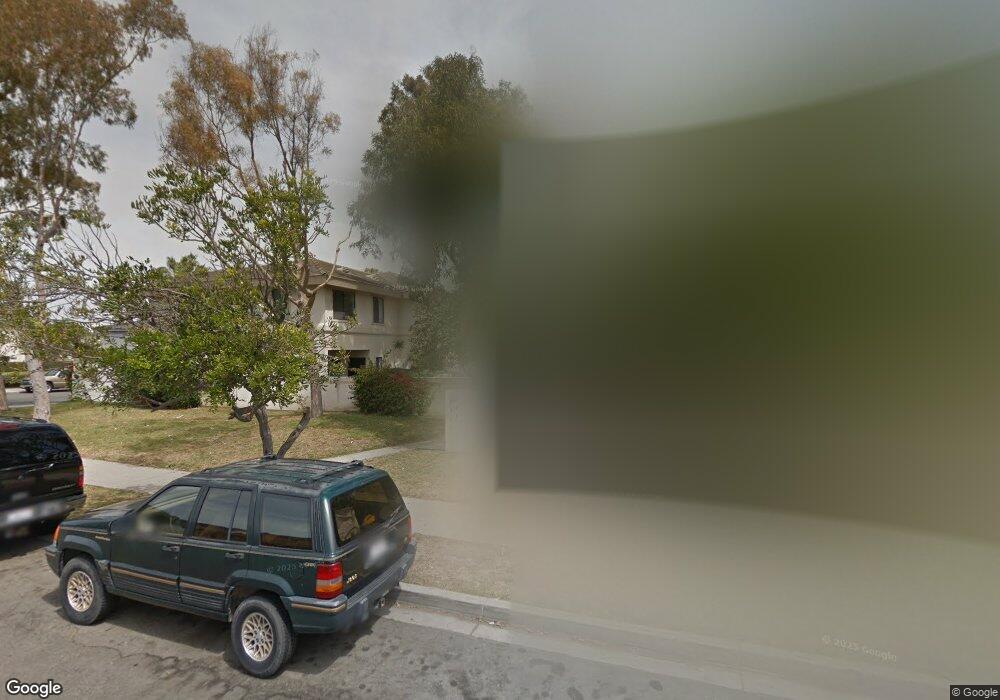
This home is located at 305 Canterbury Way Unit 3, Oxnard, CA 93033 and is currently estimated at $496,235, approximately $441 per square foot. 305 Canterbury Way Unit 3 is a home located in Ventura County with nearby schools including Art Haycox Elementary School, Hueneme High School, and St. Anthony's Elementary School.
Ownership History
We collect this data history from publicly available records. To have your information removed, we recommend requesting removal directly through your county’s website.
Purchase Details
Home Financials for this Owner
Home Financials are based on the most recent Mortgage that was taken out on this home.Purchase Details
Home Financials for this Owner
Home Financials are based on the most recent Mortgage that was taken out on this home.Home Values in the Area
Average Home Value in this Area
Purchase History
We collect this data history from publicly available records. To have your information removed, we recommend requesting removal directly through your county’s website.
| Date | Buyer | Sale Price | Title Company |
|---|---|---|---|
| $365,000 | Stewart Title Of Ca Inc | ||
| $235,000 | Pacific Coast Title Company |
Mortgage History
We collect this data history from publicly available records. To have your information removed, we recommend requesting removal directly through your county’s website.
| Date | Status | Borrower | Loan Amount |
|---|---|---|---|
| Open | $328,500 | ||
| Previous Owner | $30,000 | ||
| Previous Owner | $163,000 |
Tax History
We collect this data history from publicly available records. To have your information removed, we recommend requesting removal directly through your county’s website.
| Year | Tax Paid | Tax Assessment Tax Assessment Total Assessment is a certain percentage of the fair market value that is determined by local assessors to be the total taxable value of land and additions on the property. | Land | Improvement |
|---|---|---|---|---|
| 2025 | $4,720 | $395,086 | $257,076 | $138,010 |
| 2024 | $4,720 | $387,340 | $252,036 | $135,304 |
| 2023 | $4,443 | $379,746 | $247,095 | $132,651 |
| 2022 | $4,351 | $372,300 | $242,250 | $130,050 |
| 2021 | $4,405 | $365,000 | $237,500 | $127,500 |
| 2020 | $2,205 | $182,886 | $119,066 | $63,820 |
| 2019 | $2,138 | $179,301 | $116,732 | $62,569 |
| 2018 | $2,058 | $175,787 | $114,444 | $61,343 |
| 2017 | $1,991 | $172,341 | $112,200 | $60,141 |
| 2016 | $1,895 | $168,962 | $110,000 | $58,962 |
| 2015 | $2,733 | $228,034 | $91,212 | $136,822 |
| 2014 | $2,684 | $223,569 | $89,426 | $134,143 |
Map
- 5421 Barrymore Dr
- 4632 S C St
- 341 Cuesta Del Mar Dr
- 5340 S J St
- 4720 Cloyne St
- 1061 Gill Ave
- 165 Courtyard Dr Unit 26
- 155 Courtyard Dr
- 711 Myrna Dr
- 5117 Jefferson Square
- 5215 Jefferson Square
- 635 E Pleasant Valley Rd
- 280 Columbia Place Unit 48
- 5000 Halsey Way
- 4221 Justin Way
- 433 Jerry Dr
- 5154 Jefferson Square Unit 24
- 3935 S A St
- 187 Seabluff Dr
- 4160 Petit Dr Unit 39
- 305 Canterbury Way
- 307 Canterbury Way
- 303 Canterbury Way
- 301 Canterbury Way
- 313 Canterbury Way
- 311 Canterbury Way
- 315 Canterbury Way
- 340 W Pleasant Valley Rd
- 300 Canterbury Way
- 310 Canterbury Way
- 240 Canterbury Way Unit 3
- 240 Canterbury Way
- 403 Canterbury Way
- 320 Canterbury Way
- 401 Canterbury Way
- 407 Canterbury Way
- 405 Canterbury Way
- 230 Canterbury Way
- 200 W Pleasant Valley Rd
- 330 Canterbury Way
Ask me questions while you tour the home.