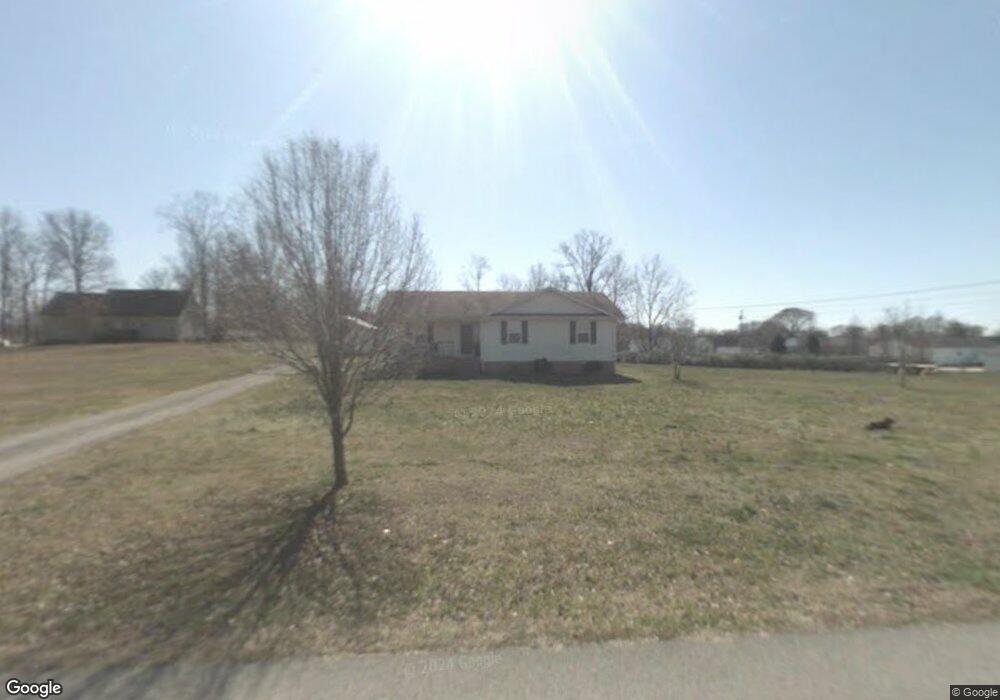
305 Cessna Ln Shelbyville, TN 37160
Estimated Value: $267,662 - $355,000
--
Bed
2
Baths
1,193
Sq Ft
$259/Sq Ft
Est. Value
About This Home
This home is located at 305 Cessna Ln, Shelbyville, TN 37160 and is currently estimated at $308,916, approximately $258 per square foot. 305 Cessna Ln is a home located in Bedford County with nearby schools including Cascade Elementary School, Cascade Middle School, and Cascade High School.
Ownership History
Date
Name
Owned For
Owner Type
Purchase Details
Closed on
Oct 31, 2012
Sold by
Gill Joseph Tyler
Bought by
Throneberry Amanda K and Throneberry Timothy A
Current Estimated Value
Home Financials for this Owner
Home Financials are based on the most recent Mortgage that was taken out on this home.
Original Mortgage
$95,918
Outstanding Balance
$66,075
Interest Rate
3.4%
Mortgage Type
Commercial
Estimated Equity
$242,841
Purchase Details
Closed on
Mar 13, 2012
Sold by
Secretary Of Housing And U
Bought by
Gill Joseph Tyler
Purchase Details
Closed on
Apr 6, 2011
Sold by
Nicholson Mulana M
Bought by
Secretary Of Housing And Urban
Purchase Details
Closed on
Feb 3, 1998
Sold by
Smith Ronald E
Bought by
Nicholson Mulana M
Purchase Details
Closed on
Oct 2, 1991
Bought by
Smith Ronald E and Smith Carol
Purchase Details
Closed on
Jun 9, 1989
Bought by
Shelton Jerry L and Shelton Margaret A
Create a Home Valuation Report for This Property
The Home Valuation Report is an in-depth analysis detailing your home's value as well as a comparison with similar homes in the area
Home Values in the Area
Average Home Value in this Area
Purchase History
| Date | Buyer | Sale Price | Title Company |
|---|---|---|---|
| Throneberry Amanda K | $94,000 | -- | |
| Gill Joseph Tyler | $55,000 | -- | |
| Secretary Of Housing And Urban | $64,838 | -- | |
| Nicholson Mulana M | $74,500 | -- | |
| Smith Ronald E | $13,800 | -- | |
| Shelton Jerry L | -- | -- |
Source: Public Records
Mortgage History
| Date | Status | Borrower | Loan Amount |
|---|---|---|---|
| Open | Throneberry Amanda K | $95,918 |
Source: Public Records
Tax History Compared to Growth
Tax History
| Year | Tax Paid | Tax Assessment Tax Assessment Total Assessment is a certain percentage of the fair market value that is determined by local assessors to be the total taxable value of land and additions on the property. | Land | Improvement |
|---|---|---|---|---|
| 2025 | $835 | $35,925 | $0 | $0 |
| 2024 | $835 | $35,925 | $8,250 | $27,675 |
| 2023 | $835 | $35,925 | $8,250 | $27,675 |
| 2022 | $835 | $35,925 | $8,250 | $27,675 |
| 2021 | $706 | $35,925 | $8,250 | $27,675 |
| 2020 | $670 | $35,925 | $8,250 | $27,675 |
| 2019 | $670 | $25,175 | $4,375 | $20,800 |
| 2018 | $644 | $25,175 | $4,375 | $20,800 |
| 2017 | $644 | $25,175 | $4,375 | $20,800 |
| 2016 | $634 | $25,175 | $4,375 | $20,800 |
| 2015 | $634 | $25,175 | $4,375 | $20,800 |
| 2014 | $509 | $22,412 | $0 | $0 |
Source: Public Records
Map
Nearby Homes
- 2936 Midland Rd
- 289 Pinkston Rd
- 0 Pinkston Rd Unit 21080136
- 0 Pinkston Rd Unit RTC2797276
- 2697 Midland Rd
- 0 Harts Chapel Rd
- 103 Horseshoe Ct
- 2511 Unionville Deason Rd
- 2230 Unionville Deason Rd
- 2385 Unionville Deason Rd
- 0 Old Nashville Dirt Rd
- 2250 Unionville Deason Rd
- 1802 Old Nashville Dirt Rd
- 2242 Unionville Deason Rd
- 2190 Unionville Deason Rd
- 108 Rabbit Run
- 215 Highway 82 E
- 2152 Unionville Deason Rd
- 292 Gregory Mill Rd
- 0 Minkslide Rd
- 112 Lindbergh Ln
- 306 Cessna Ln
- 307 Cessna Ln
- 300 Cessna Ln
- 108 Lindbergh Ln
- 116 Lindbergh Ln
- 0 Cessna Lane Lot 50
- 111 Lindbergh Ln
- 115 Lindbergh Ln
- 214 Cessna Ln
- 120 Lindbergh Ln
- 205 Cessna Ln
- 339 Cessna Ln
- 107 Lindbergh Ln
- 312 Cessna Ln
- 201 Cessna Ln
- 335 Cessna Ln
- 119 Lindbergh Ln
- 313 Cessna Ln
- 210 Cessna Ln