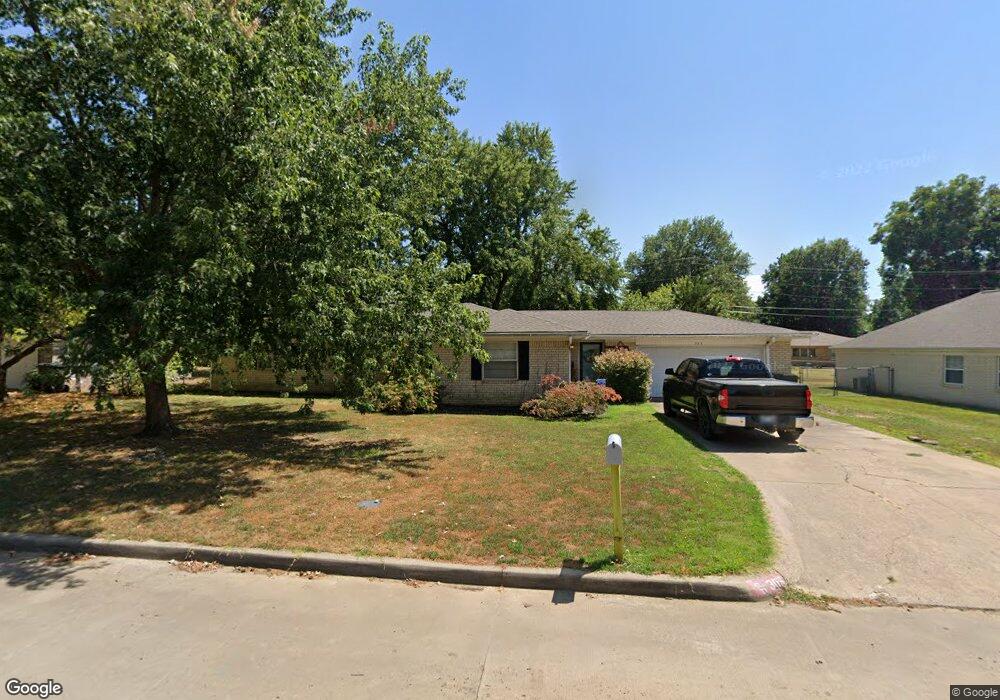
305 E 16th St Claremore, OK 74017
Estimated Value: $200,563 - $222,000
3
Beds
2
Baths
1,573
Sq Ft
$133/Sq Ft
Est. Value
About This Home
This home is located at 305 E 16th St, Claremore, OK 74017 and is currently estimated at $209,641, approximately $133 per square foot. 305 E 16th St is a home located in Rogers County with nearby schools including Roosa Elementary School, Will Rogers Junior High School, and Claremore High School.
Ownership History
Date
Name
Owned For
Owner Type
Purchase Details
Closed on
Mar 28, 2013
Sold by
Dopp Property Co
Bought by
Delozier Hannah K and Delozier Hannah Kay
Current Estimated Value
Home Financials for this Owner
Home Financials are based on the most recent Mortgage that was taken out on this home.
Original Mortgage
$103,098
Outstanding Balance
$71,790
Interest Rate
3.25%
Mortgage Type
FHA
Estimated Equity
$137,851
Purchase Details
Closed on
Jul 17, 2007
Sold by
Wade Ronald J and Wade Vicki
Bought by
Dopp Property Co
Home Financials for this Owner
Home Financials are based on the most recent Mortgage that was taken out on this home.
Original Mortgage
$194,348
Interest Rate
6.73%
Mortgage Type
Purchase Money Mortgage
Purchase Details
Closed on
Apr 18, 2006
Sold by
Homer Bradley S and Homer Melinda M
Bought by
Wade Ronald J and Wade Vicki
Purchase Details
Closed on
Jan 1, 2003
Sold by
Roberts J Thompson
Purchase Details
Closed on
Jun 12, 2001
Sold by
Wilson Oliver W
Create a Home Valuation Report for This Property
The Home Valuation Report is an in-depth analysis detailing your home's value as well as a comparison with similar homes in the area
Home Values in the Area
Average Home Value in this Area
Purchase History
| Date | Buyer | Sale Price | Title Company |
|---|---|---|---|
| Delozier Hannah K | $105,000 | None Available | |
| Dopp Property Co | $115,000 | Land Title Closing Services | |
| Wade Ronald J | $123,500 | None Available | |
| -- | $100,000 | -- | |
| -- | $80,000 | -- |
Source: Public Records
Mortgage History
| Date | Status | Borrower | Loan Amount |
|---|---|---|---|
| Open | Delozier Hannah K | $103,098 | |
| Previous Owner | Dopp Property Co | $194,348 |
Source: Public Records
Tax History
| Year | Tax Paid | Tax Assessment Tax Assessment Total Assessment is a certain percentage of the fair market value that is determined by local assessors to be the total taxable value of land and additions on the property. | Land | Improvement |
|---|---|---|---|---|
| 2025 | $1,213 | $14,128 | $3,657 | $10,471 |
| 2024 | $1,175 | $13,716 | $3,550 | $10,166 |
| 2023 | $1,175 | $13,317 | $3,324 | $9,993 |
| 2022 | $1,104 | $12,929 | $2,970 | $9,959 |
| 2021 | $1,090 | $13,347 | $2,970 | $10,377 |
| 2020 | $1,113 | $13,151 | $2,970 | $10,181 |
| 2019 | $1,104 | $12,924 | $2,970 | $9,954 |
| 2018 | $1,132 | $13,614 | $2,970 | $10,644 |
| 2017 | $1,089 | $12,862 | $2,970 | $9,892 |
| 2016 | $1,078 | $12,488 | $2,970 | $9,518 |
| 2015 | $1,032 | $12,124 | $2,970 | $9,154 |
| 2014 | $1,040 | $12,212 | $2,970 | $9,242 |
Source: Public Records
Map
Nearby Homes
- 1411 N Choctaw Place
- 320 E 17th St
- 337 E 15th St
- 1402 N Dorothy Ave
- 1335 N Mcfarland Place
- 125 E Powell St
- 1929 Lexington Rd
- 110 E 13th Place
- 1925 Bristol Rd
- 814 E Comet St
- 1114 N Osage Ave
- 401 W Blue Starr Dr
- 1137 N Oklahoma Ave
- 1805 NE Oakridge Dr
- 601 E 11th St
- 607 E 11th St
- 817 E 11th St
- 821 E 11th St
- 0 N J M Davis Blvd
- 119 N Missouri Ave
- 309 E 16th St
- 301 E 16th St
- 308 E 15th St
- 300 E 16th St
- 310 E 15th St
- 306 E 16th St
- 304 E 15th St
- 314 E 15th St
- 313 E 16th St
- 308 E 16th St
- 318 E 15th St
- 303 E 17th St
- 1505 N Louisville Ave
- 317 E 16th St
- 309 E 15th St
- 1421 N Dorothy Ave
- 1507 N Louisville Ave
- 305 E 17th St
- 1418 N Louisville Ave
- 301 E 17th St
Your Personal Tour Guide
Ask me questions while you tour the home.