Estimated Value: $240,940 - $743,000
--
Bed
2
Baths
1,460
Sq Ft
$316/Sq Ft
Est. Value
About This Home
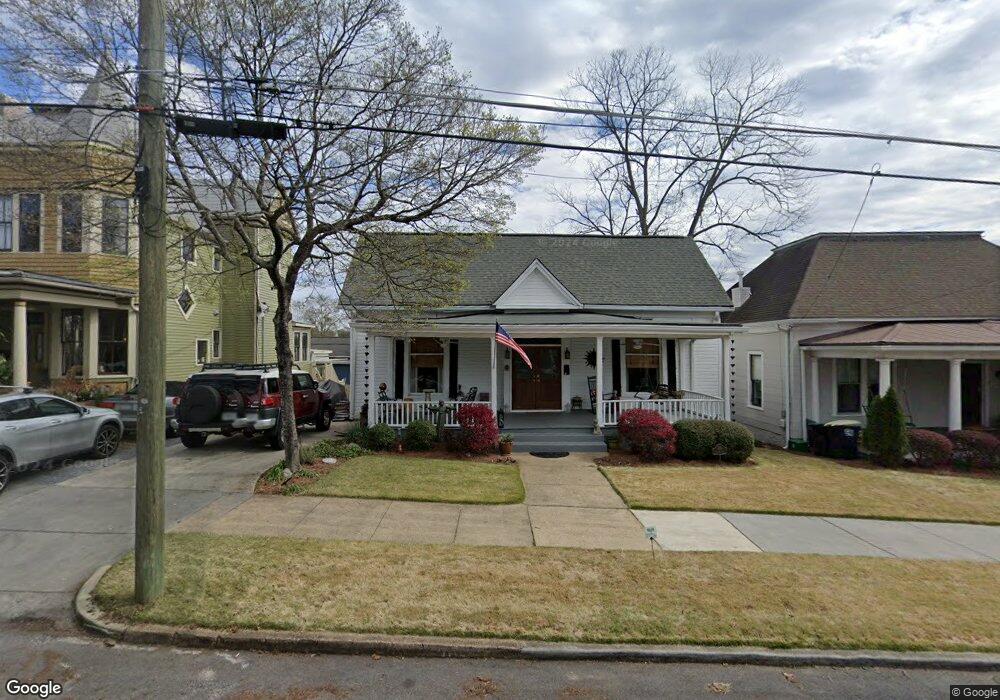
This home is located at 305 E 5th Ave, Rome, GA 30161 and is currently estimated at $461,235, approximately $315 per square foot. 305 E 5th Ave is a home located in Floyd County with nearby schools including Rome High School, St. Mary School, and Darlington School.
Ownership History
Date
Name
Owned For
Owner Type
Purchase Details
Closed on
May 26, 2016
Sold by
Canalis Lorenzo
Bought by
Shealy Jennifer M and Shealy Lee M
Current Estimated Value
Home Financials for this Owner
Home Financials are based on the most recent Mortgage that was taken out on this home.
Original Mortgage
$117,322
Outstanding Balance
$48,322
Interest Rate
2.89%
Mortgage Type
New Conventional
Estimated Equity
$412,913
Purchase Details
Closed on
May 18, 2000
Sold by
Brock Edward L
Bought by
Canalis Lorenzo and Janda Canalis
Purchase Details
Closed on
Jan 9, 1998
Sold by
Brock Bonnnie B
Bought by
Brock Edward L
Purchase Details
Closed on
Jun 15, 1992
Sold by
Brock Para Lee
Bought by
Brock Bonnnie B
Purchase Details
Closed on
Jul 24, 1990
Sold by
Brock Bonnie B Miss
Bought by
Brock Para Lee
Purchase Details
Closed on
Dec 28, 1955
Bought by
Brock Bonnie B Miss
Create a Home Valuation Report for This Property
The Home Valuation Report is an in-depth analysis detailing your home's value as well as a comparison with similar homes in the area
Home Values in the Area
Average Home Value in this Area
Purchase History
| Date | Buyer | Sale Price | Title Company |
|---|---|---|---|
| Shealy Jennifer M | $123,497 | -- | |
| Canalis Lorenzo | $83,000 | -- | |
| Brock Edward L | $40,000 | -- | |
| Brock Bonnnie B | -- | -- | |
| Brock Para Lee | -- | -- | |
| Brock Bonnie B Miss | -- | -- |
Source: Public Records
Mortgage History
| Date | Status | Borrower | Loan Amount |
|---|---|---|---|
| Open | Shealy Jennifer M | $117,322 |
Source: Public Records
Tax History
| Year | Tax Paid | Tax Assessment Tax Assessment Total Assessment is a certain percentage of the fair market value that is determined by local assessors to be the total taxable value of land and additions on the property. | Land | Improvement |
|---|---|---|---|---|
| 2025 | $2,969 | $109,914 | $14,476 | $95,438 |
| 2024 | $2,969 | $103,113 | $13,160 | $89,953 |
| 2023 | $3,652 | $98,126 | $11,844 | $86,282 |
| 2022 | $3,022 | $82,807 | $9,776 | $73,031 |
| 2021 | $2,842 | $76,595 | $9,776 | $66,819 |
| 2020 | $2,679 | $71,608 | $7,520 | $64,088 |
| 2019 | $2,545 | $68,754 | $7,520 | $61,234 |
| 2018 | $2,437 | $65,828 | $7,520 | $58,308 |
| 2017 | $1,829 | $50,255 | $7,520 | $42,735 |
| 2016 | $1,734 | $46,680 | $7,520 | $39,160 |
| 2015 | $1,308 | $46,680 | $7,520 | $39,160 |
| 2014 | $1,308 | $37,308 | $5,640 | $31,668 |
Source: Public Records
Map
Nearby Homes
- 501 E 3rd St
- 204 E 5th Ave
- 407 E 3rd St
- 202 E 4th Ave Unit 5
- 633 E 3rd St
- 312 E 3rd St
- 29 Pear St
- 138 E 8th Ave Unit 25
- 214 E 3rd St
- 167 Sweet Water Ln
- 1 E 3rd Ave Unit 302
- 320 E 3rd Ave
- 10 E 3rd Ave
- 8 E 3rd Ave
- 0 Brook Valley Ct Unit 10665224
- 0 Brook Valley Ct Unit 7698646
- 102 Smith St NE
- 311 Roswell Ave SE
- 2 Coral Ave SW
- 715 Avenue A NE
Your Personal Tour Guide
Ask me questions while you tour the home.