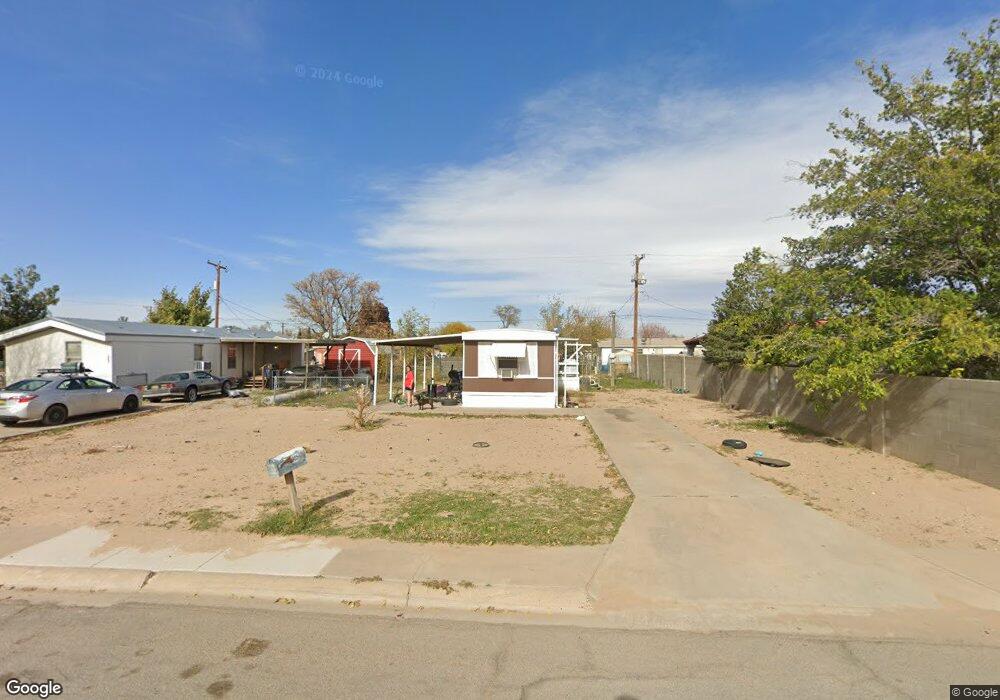
305 E Onyx St Roswell, NM 88203
--
Bed
--
Bath
--
Sq Ft
--
Built
About This Home
This home is located at 305 E Onyx St, Roswell, NM 88203. 305 E Onyx St is a home located in Chaves County with nearby schools including Monterrey Elementary School, Mountain View Middle School, and Roswell High School.
Create a Home Valuation Report for This Property
The Home Valuation Report is an in-depth analysis detailing your home's value as well as a comparison with similar homes in the area
Tax History
| Year | Tax Paid | Tax Assessment Tax Assessment Total Assessment is a certain percentage of the fair market value that is determined by local assessors to be the total taxable value of land and additions on the property. | Land | Improvement |
|---|---|---|---|---|
| 2025 | $63 | $2,931 | $0 | $2,931 |
| 2024 | $62 | $2,845 | $0 | $2,845 |
| 2023 | $62 | $2,763 | $0 | $2,763 |
| 2022 | $61 | $2,682 | $0 | $2,682 |
| 2021 | $60 | $2,604 | $0 | $2,604 |
| 2020 | $58 | $2,548 | $0 | $2,548 |
| 2019 | $57 | $2,500 | $0 | $2,500 |
| 2018 | $55 | $2,428 | $0 | $2,428 |
| 2017 | $57 | $2,556 | $0 | $2,556 |
| 2016 | $57 | $2,482 | $0 | $2,482 |
| 2015 | $60 | $2,410 | $0 | $2,410 |
| 2014 | $96 | $3,818 | $0 | $3,818 |
Source: Public Records
Map
Nearby Homes
- 205 E Hervey St
- 1901 S Main St
- oooo Sapphire St
- 00 SE Main St
- 000 SE Main St
- 1915 S Pennsylvania Ave
- 306 E Mccune St
- 5901 S Main St
- 5831 S Main St
- 2103 S Main St
- 5905 S Main St
- 8703 S Main St
- 2698 S Main St
- 2803 S Onyx Dr
- 2706 W Onyx St
- 2805 S Onyx Dr
- 2807 S Onyx Dr
- 2800 W Onyx St
- 1800 S Pennsylvania Ave
- 100 Blk Jaffa St
Your Personal Tour Guide
Ask me questions while you tour the home.