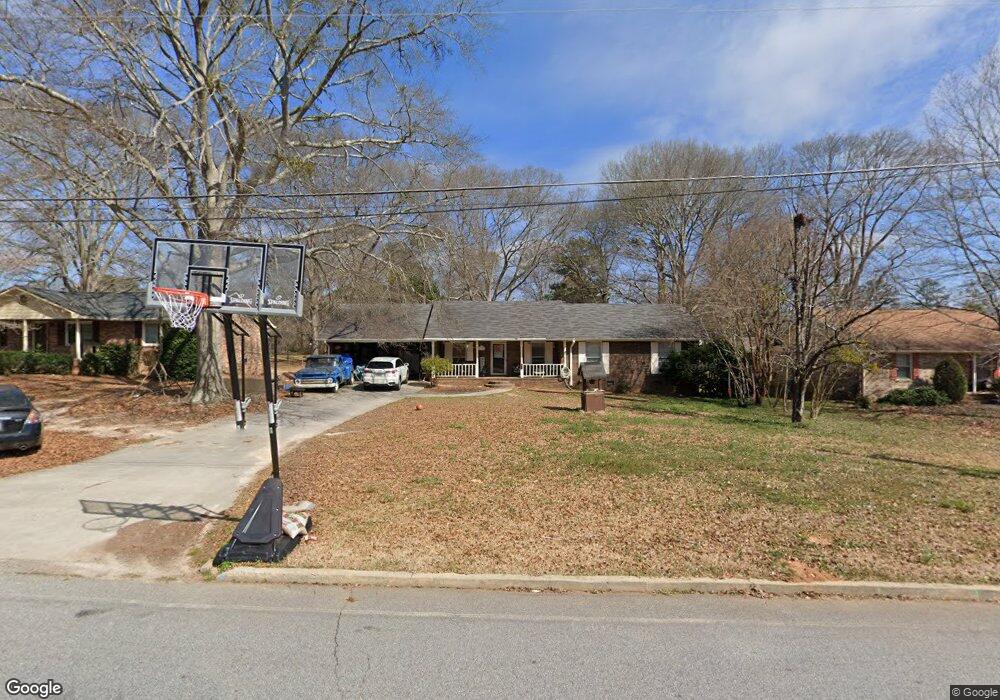
305 Gail Dr Griffin, GA 30224
Spalding County NeighborhoodEstimated Value: $210,032 - $255,000
--
Bed
2
Baths
1,640
Sq Ft
$147/Sq Ft
Est. Value
About This Home
This home is located at 305 Gail Dr, Griffin, GA 30224 and is currently estimated at $241,258, approximately $147 per square foot. 305 Gail Dr is a home located in Spalding County with nearby schools including Crescent Road Elementary School, Rehoboth Road Middle School, and Spalding High School.
Ownership History
Date
Name
Owned For
Owner Type
Purchase Details
Closed on
Jan 30, 2013
Sold by
Mcclain Linda M
Bought by
Helms Marty G
Current Estimated Value
Home Financials for this Owner
Home Financials are based on the most recent Mortgage that was taken out on this home.
Original Mortgage
$93,253
Outstanding Balance
$64,705
Interest Rate
3.25%
Mortgage Type
FHA
Estimated Equity
$176,553
Purchase Details
Closed on
Jun 21, 1984
Sold by
Tiller Paul Ronald
Bought by
Melton Lawrence C and Melton Helen
Purchase Details
Closed on
May 1, 1984
Sold by
Shiflett Reginald
Bought by
Tiller Paul Ronald
Purchase Details
Closed on
Jan 1, 1984
Sold by
Prothro Charles P and Prothro Janet R
Bought by
Shiflett Reginald
Purchase Details
Closed on
May 12, 1983
Sold by
Shiflett Riginald
Bought by
Prothro Charles P and Prothro Janet R
Purchase Details
Closed on
Mar 1, 1982
Sold by
Nichols John H and John Middlebrooks
Bought by
Shiflett Riginald
Purchase Details
Closed on
Sep 19, 1980
Sold by
Blake Otis and Blake Andrew
Bought by
Nichols John H and John Middlebrooks
Create a Home Valuation Report for This Property
The Home Valuation Report is an in-depth analysis detailing your home's value as well as a comparison with similar homes in the area
Home Values in the Area
Average Home Value in this Area
Purchase History
| Date | Buyer | Sale Price | Title Company |
|---|---|---|---|
| Helms Marty G | $95,000 | -- | |
| Melton Lawrence C | $60,500 | -- | |
| Tiller Paul Ronald | $5,200 | -- | |
| Shiflett Reginald | -- | -- | |
| Prothro Charles P | $54,800 | -- | |
| Shiflett Riginald | $10,000 | -- | |
| Nichols John H | $12,000 | -- |
Source: Public Records
Mortgage History
| Date | Status | Borrower | Loan Amount |
|---|---|---|---|
| Open | Helms Marty G | $93,253 |
Source: Public Records
Tax History Compared to Growth
Tax History
| Year | Tax Paid | Tax Assessment Tax Assessment Total Assessment is a certain percentage of the fair market value that is determined by local assessors to be the total taxable value of land and additions on the property. | Land | Improvement |
|---|---|---|---|---|
| 2024 | $2,453 | $64,230 | $8,000 | $56,230 |
| 2023 | $2,453 | $61,275 | $8,000 | $53,275 |
| 2022 | $2,329 | $58,287 | $6,800 | $51,487 |
| 2021 | $2,046 | $51,190 | $6,800 | $44,390 |
| 2020 | $1,745 | $43,656 | $6,800 | $36,856 |
| 2019 | $1,632 | $40,110 | $6,800 | $33,310 |
| 2018 | $1,646 | $38,978 | $6,800 | $32,178 |
| 2017 | $1,611 | $38,978 | $6,800 | $32,178 |
| 2016 | $1,567 | $37,302 | $6,800 | $30,502 |
| 2015 | $1,592 | $37,302 | $6,800 | $30,502 |
| 2014 | $1,641 | $37,302 | $6,800 | $30,502 |
Source: Public Records
Map
Nearby Homes
- 227 Brown Acres Rd
- 1473 Gloria St
- 133 Coldwater Ln
- 1463 Gloria St
- 114 Maddox Rd
- 139 Coldwater Ln
- 0 Martin Luther King jr Pkwy Unit 19-41 BYPASS HIGHWAY
- 422 Maddox Rd
- 109 Maddox Rd
- 1491 Wesley Dr
- 1209 Ethridge Mill Rd
- 1082 Coldwater Dr
- 1064 Cold Water Dr
- 101 Coldwater Ln
- 1440 Wesley Dr
- 316 Wynterhall Dr
- 311 Ashford Place
- 1801, 1831 & 19 Zebulon Rd
- 319 Sweetbriar Ln
- 405 Crescent Ct
- 307 Gail Dr
- 303 Gail Dr
- 0 Gail Dr Unit 7143004
- 0 Gail Dr Unit 7380078
- 0 Gail Dr Unit 3179822
- 0 Gail Dr Unit 8553327
- 0 Gail Dr Unit 8530748
- 0 Gail Dr Unit 8531972
- 0 Gail Dr Unit 8522573
- 306 Maddox Rd
- 246 Brown Acres Rd
- 309 Gail Dr
- 301 Gail Dr
- 304 Maddox Rd
- 304 Gail Dr
- 310 Maddox Rd
- 306 Gail Dr
- 308 Gail Dr
- 302 Maddox Rd
- 242 Leslie Ln