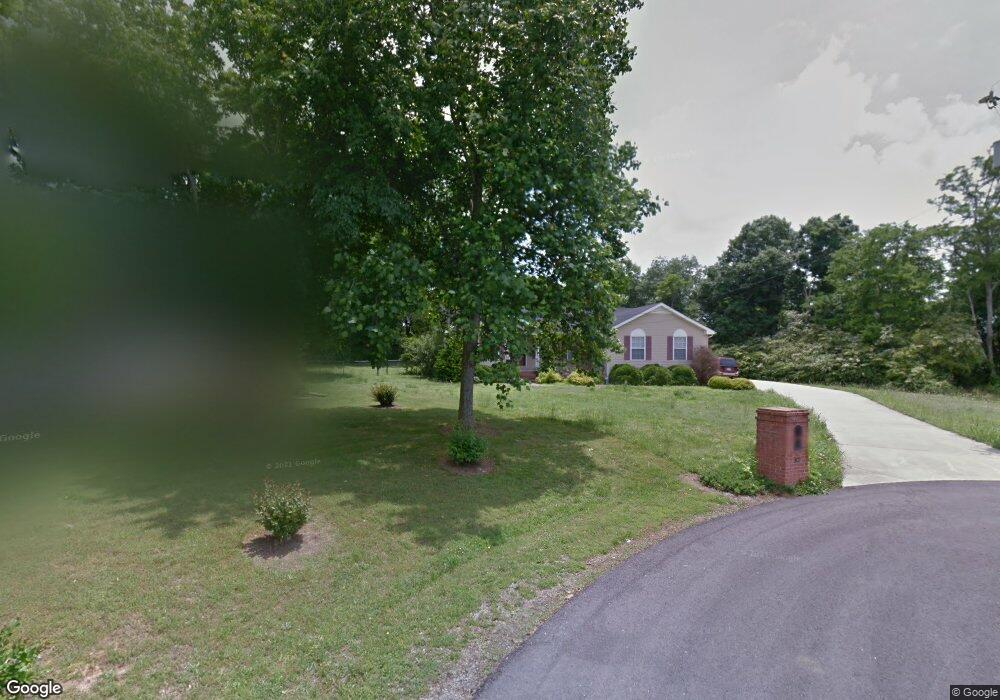
305 Keenan Ln Shelbyville, TN 37160
Estimated Value: $248,486 - $322,000
--
Bed
2
Baths
1,363
Sq Ft
$213/Sq Ft
Est. Value
About This Home
This home is located at 305 Keenan Ln, Shelbyville, TN 37160 and is currently estimated at $290,872, approximately $213 per square foot. 305 Keenan Ln is a home located in Bedford County with nearby schools including South Side Elementary School, Harris Middle School, and Christian Chapel Academy.
Ownership History
Date
Name
Owned For
Owner Type
Purchase Details
Closed on
Oct 21, 2011
Sold by
Federal Home Loan Mortgage Corporation
Bought by
Speegle Amber N
Current Estimated Value
Home Financials for this Owner
Home Financials are based on the most recent Mortgage that was taken out on this home.
Original Mortgage
$97,959
Outstanding Balance
$66,728
Interest Rate
4.15%
Mortgage Type
Commercial
Estimated Equity
$224,144
Purchase Details
Closed on
Jun 6, 2011
Sold by
Chavez Sergio
Bought by
Federal Home Loan Mortgage Corporation
Purchase Details
Closed on
Dec 28, 2007
Sold by
Edwards Joseph A
Bought by
Chavez Sergio
Purchase Details
Closed on
Oct 19, 2004
Sold by
Swing Ben M
Bought by
Edwards Joseph A
Home Financials for this Owner
Home Financials are based on the most recent Mortgage that was taken out on this home.
Original Mortgage
$105,311
Interest Rate
5.64%
Purchase Details
Closed on
Dec 4, 1997
Bought by
Swing Ben M and Swing Kara L
Purchase Details
Closed on
Oct 30, 1997
Sold by
Burks James H
Bought by
Glover G G Elsie
Purchase Details
Closed on
Sep 14, 1987
Bought by
Burks James H and Bettie Sue
Create a Home Valuation Report for This Property
The Home Valuation Report is an in-depth analysis detailing your home's value as well as a comparison with similar homes in the area
Home Values in the Area
Average Home Value in this Area
Purchase History
| Date | Buyer | Sale Price | Title Company |
|---|---|---|---|
| Speegle Amber N | $96,000 | -- | |
| Federal Home Loan Mortgage Corporation | $96,000 | -- | |
| Chavez Sergio | $142,500 | -- | |
| Edwards Joseph A | $103,500 | -- | |
| Swing Ben M | $80,900 | -- | |
| Glover G G Elsie | $1,200 | -- | |
| Burks James H | -- | -- |
Source: Public Records
Mortgage History
| Date | Status | Borrower | Loan Amount |
|---|---|---|---|
| Open | Speegle Amber N | $97,959 | |
| Previous Owner | Burks James H | $105,311 |
Source: Public Records
Tax History Compared to Growth
Tax History
| Year | Tax Paid | Tax Assessment Tax Assessment Total Assessment is a certain percentage of the fair market value that is determined by local assessors to be the total taxable value of land and additions on the property. | Land | Improvement |
|---|---|---|---|---|
| 2025 | -- | $41,375 | $0 | $0 |
| 2024 | -- | $41,375 | $8,250 | $33,125 |
| 2023 | $1,574 | $41,375 | $8,250 | $33,125 |
| 2022 | $1,620 | $41,375 | $8,250 | $33,125 |
| 2021 | $1,471 | $41,375 | $8,250 | $33,125 |
| 2020 | $1,242 | $41,375 | $8,250 | $33,125 |
| 2019 | $1,242 | $28,050 | $5,750 | $22,300 |
| 2018 | $1,214 | $28,050 | $5,750 | $22,300 |
| 2017 | $1,214 | $28,050 | $5,750 | $22,300 |
| 2016 | $1,203 | $28,050 | $5,750 | $22,300 |
| 2015 | $1,203 | $28,050 | $5,750 | $22,300 |
| 2014 | $1,082 | $27,607 | $0 | $0 |
Source: Public Records
Map
Nearby Homes
- 302 Keenan Ln
- 303 Keenan Ln
- 301 Keenan Ln
- 300 Keenan Ln
- 101 Edgeview Dr
- 217 Keenan Ln
- 103 Edgeview Dr
- 215 Keenan Ln
- 214 Keenan Ln
- 1512 S Cannon Blvd
- 1514 S Cannon Blvd
- 213 Keenan Ln
- 212 Keenan Ln
- 1504 S Cannon Blvd
- 105 Edgeview Dr
- 305 Tyne Rd
- 1520 S Cannon Blvd
- 211 Keenan Ln
- 210 Keenan Ln
- 303 Tyne Rd