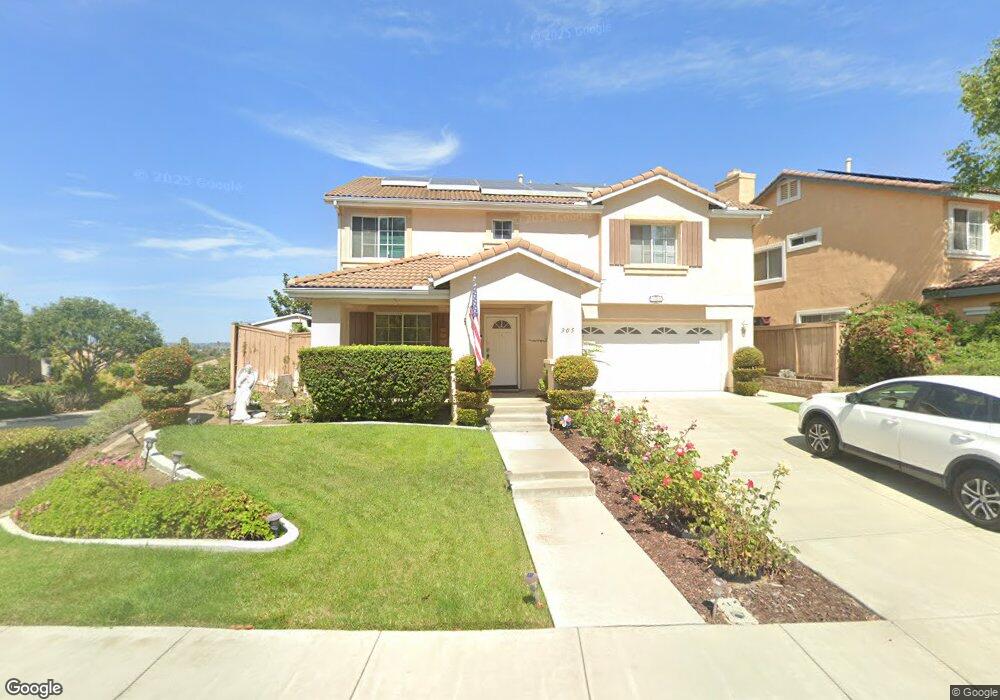
305 La Soledad Way Oceanside, CA 92057
San Luis Rey NeighborhoodEstimated Value: $991,000 - $1,013,426
4
Beds
3
Baths
2,564
Sq Ft
$390/Sq Ft
Est. Value
About This Home
This home is located at 305 La Soledad Way, Oceanside, CA 92057 and is currently estimated at $1,000,107, approximately $390 per square foot. 305 La Soledad Way is a home located in San Diego County with nearby schools including Nichols Elementary School, Martin Luther King Jr. Middle School, and El Camino High School.
Ownership History
Date
Name
Owned For
Owner Type
Purchase Details
Closed on
Nov 25, 2019
Sold by
James Larry and James Louise
Bought by
James Louise M and The Louise James Revocable Liv
Current Estimated Value
Purchase Details
Closed on
Oct 5, 2009
Sold by
James Larry C and James Louise M
Bought by
James Larry and James Louise
Purchase Details
Closed on
Oct 15, 2001
Sold by
Genstar Southwest Oasis Llc
Bought by
Fieldstone Communities Inc
Home Financials for this Owner
Home Financials are based on the most recent Mortgage that was taken out on this home.
Original Mortgage
$625,632
Interest Rate
6.62%
Mortgage Type
Seller Take Back
Purchase Details
Closed on
Sep 25, 2001
Sold by
Fieldstone Communities Inc
Bought by
James Larry C and James Louise M
Home Financials for this Owner
Home Financials are based on the most recent Mortgage that was taken out on this home.
Original Mortgage
$625,632
Interest Rate
6.62%
Mortgage Type
Seller Take Back
Create a Home Valuation Report for This Property
The Home Valuation Report is an in-depth analysis detailing your home's value as well as a comparison with similar homes in the area
Home Values in the Area
Average Home Value in this Area
Purchase History
| Date | Buyer | Sale Price | Title Company |
|---|---|---|---|
| James Louise M | -- | None Available | |
| James Larry | -- | None Available | |
| Fieldstone Communities Inc | -- | First American Title | |
| James Larry C | $341,000 | First American Title |
Source: Public Records
Mortgage History
| Date | Status | Borrower | Loan Amount |
|---|---|---|---|
| Previous Owner | Fieldstone Communities Inc | $625,632 | |
| Previous Owner | James Larry C | $272,650 | |
| Closed | James Larry C | $34,050 |
Source: Public Records
Tax History
| Year | Tax Paid | Tax Assessment Tax Assessment Total Assessment is a certain percentage of the fair market value that is determined by local assessors to be the total taxable value of land and additions on the property. | Land | Improvement |
|---|---|---|---|---|
| 2025 | $5,480 | $503,546 | $228,971 | $274,575 |
| 2024 | $5,480 | $493,674 | $224,482 | $269,192 |
| 2023 | $5,310 | $483,995 | $220,081 | $263,914 |
| 2022 | $5,228 | $474,506 | $215,766 | $258,740 |
| 2021 | $5,247 | $465,203 | $211,536 | $253,667 |
| 2020 | $5,084 | $460,433 | $209,367 | $251,066 |
| 2019 | $4,935 | $451,406 | $205,262 | $246,144 |
| 2018 | $4,881 | $442,556 | $201,238 | $241,318 |
| 2017 | $71 | $433,880 | $197,293 | $236,587 |
| 2016 | $4,633 | $425,374 | $193,425 | $231,949 |
| 2015 | $4,497 | $418,985 | $190,520 | $228,465 |
| 2014 | $4,321 | $410,778 | $186,788 | $223,990 |
Source: Public Records
Map
Nearby Homes
- 232 Manzanilla Way
- 4743 Maclura St
- 4885 Baroque Terrace
- 4802 Baroque Terrace
- 4733 Dalea Place
- 4540 Arbor Glen Way
- 838 Masters Dr
- 4468 White Pine Way
- 255 Flame Tree Place
- 101 Avenida Las Brisas
- 1014 Plover Way
- 1020 Turnstone Way
- 761 Masters Dr
- 4440 Skimmer Way
- 4791 Macadamia Ct
- 1029 Turnstone Way
- 1034 Turnstone Way
- 4402 Chickadee Way
- 4395 Albatross Way
- 4386 Albatross Way
- 301 La Soledad Way
- 304 La Purisma Way
- 309 La Soledad Way
- 308 La Purisma Way
- 264 Manzanilla Way
- 268 Manzanilla Way
- 314 La Soledad Way
- 318 La Soledad Way
- 272 Manzanilla Way
- 260 Manzanilla Way
- 322 La Soledad Way
- 313 La Soledad Way
- 310 La Soledad Way
- 276 Manzanilla Way
- 312 La Purisma Way
- 303 La Purisma Way
- 326 La Soledad Way
- 306 La Soledad Way
- 302 La Soledad Way
- 280 Manzanilla Way
Your Personal Tour Guide
Ask me questions while you tour the home.