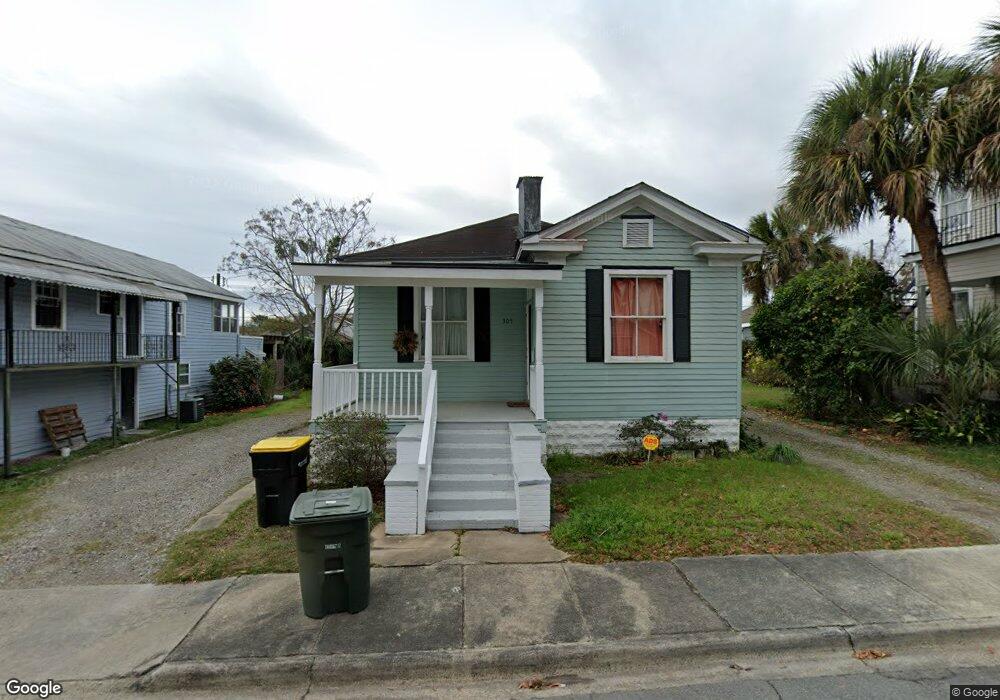
305 Maupas Ave Savannah, GA 31401
Thomas Square NeighborhoodEstimated Value: $332,000 - $391,657
2
Beds
1
Bath
1,362
Sq Ft
$271/Sq Ft
Est. Value
About This Home
This home is located at 305 Maupas Ave, Savannah, GA 31401 and is currently estimated at $368,914, approximately $270 per square foot. 305 Maupas Ave is a home located in Chatham County with nearby schools including Shuman Elementary School, Hubert Middle School, and Savannah Arts Academy.
Ownership History
Date
Name
Owned For
Owner Type
Purchase Details
Closed on
Sep 17, 2010
Sold by
Darby Bank & Trust Co
Bought by
Fishman Jane F and Aliffi Carmela
Current Estimated Value
Home Financials for this Owner
Home Financials are based on the most recent Mortgage that was taken out on this home.
Original Mortgage
$56,250
Outstanding Balance
$37,144
Interest Rate
4.44%
Mortgage Type
Commercial
Estimated Equity
$331,770
Purchase Details
Closed on
Jul 6, 2010
Sold by
Effird William C
Bought by
Darby Bank Of Trust Co
Create a Home Valuation Report for This Property
The Home Valuation Report is an in-depth analysis detailing your home's value as well as a comparison with similar homes in the area
Home Values in the Area
Average Home Value in this Area
Purchase History
| Date | Buyer | Sale Price | Title Company |
|---|---|---|---|
| Fishman Jane F | $75,000 | -- | |
| Darby Bank Of Trust Co | -- | -- |
Source: Public Records
Mortgage History
| Date | Status | Borrower | Loan Amount |
|---|---|---|---|
| Open | Fishman Jane F | $56,250 |
Source: Public Records
Tax History Compared to Growth
Tax History
| Year | Tax Paid | Tax Assessment Tax Assessment Total Assessment is a certain percentage of the fair market value that is determined by local assessors to be the total taxable value of land and additions on the property. | Land | Improvement |
|---|---|---|---|---|
| 2025 | $8,103 | $138,960 | $50,000 | $88,960 |
| 2024 | $8,103 | $139,440 | $50,000 | $89,440 |
| 2023 | $1,683 | $137,960 | $50,000 | $87,960 |
| 2022 | $1,271 | $104,160 | $32,000 | $72,160 |
| 2021 | $3,680 | $85,000 | $26,000 | $59,000 |
| 2020 | $2,314 | $84,440 | $26,000 | $58,440 |
| 2019 | $3,256 | $73,280 | $26,000 | $47,280 |
| 2018 | $3,254 | $72,360 | $26,000 | $46,360 |
| 2017 | $2,621 | $63,080 | $15,560 | $47,520 |
| 2016 | $1,833 | $62,840 | $15,560 | $47,280 |
| 2015 | $2,672 | $64,080 | $15,560 | $48,520 |
| 2014 | $3,153 | $59,840 | $0 | $0 |
Source: Public Records
Map
Nearby Homes
- 309 E 41st St
- 121 E Victory Dr
- 501 E 41st St
- 111 E 39th St
- 0 E Victory Dr Unit SA342445
- 2114 Lincoln St
- 110 E 38th St
- 510 E 39th St
- 102 E 38th St
- 2406 De Soto Ave Unit B
- 215 E 45th St
- 206 E 46th St
- 123 E 46th St
- 17 E 37th St Unit 11
- 17 E 37th St Unit 3
- 17 E 37th St Unit 12
- 34 Washington Ave
- 302 E 46th St
- 317 E 45th St
- 607 Seiler Ave
- 311 Maupas Ave
- 2422 Lincoln St
- 306 E 41st St
- 2426 Lincoln St
- 304 Maupas Ave
- 306 Maupas Ave
- 2410 Lincoln St
- 310 E 41st St
- 308 E 41st St
- 302 E 41st St
- 2408 Lincoln St
- 2431 Habersham St
- 224 E 41st St
- 2411 Habersham St Unit 5
- 2411 Habersham St Unit 1,2,3,4
- 2411 Habersham St
- 2411 Habersham St Unit 6
- 2411 Habersham St Unit 4
- 2411 Habersham St Unit 8
- 2411 Habersham St Unit 7