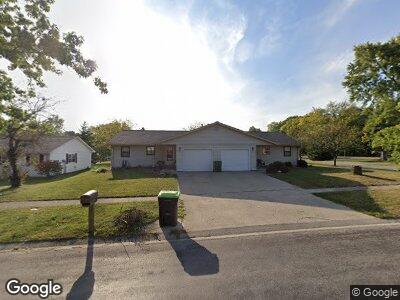
305 N Raymond Dr Mahomet, IL 61853
Estimated Value: $244,000 - $272,000
--
Bed
2
Baths
1,260
Sq Ft
$202/Sq Ft
Est. Value
About This Home
This home is located at 305 N Raymond Dr, Mahomet, IL 61853 and is currently estimated at $254,695, approximately $202 per square foot. 305 N Raymond Dr is a home located in Champaign County with nearby schools including Middletown Prairie Elementary and First School.
Ownership History
Date
Name
Owned For
Owner Type
Purchase Details
Closed on
Nov 15, 2023
Sold by
Shaw Ronald and Shaw Susan
Bought by
Bh Capital Llc
Current Estimated Value
Home Financials for this Owner
Home Financials are based on the most recent Mortgage that was taken out on this home.
Original Mortgage
$179,000
Outstanding Balance
$176,684
Interest Rate
7.63%
Mortgage Type
New Conventional
Estimated Equity
$79,613
Purchase Details
Closed on
Jun 7, 2019
Sold by
Shaw Lochner Patricia and Lochner Jerome
Bought by
Shaw Ronald and Shaw Susan
Home Financials for this Owner
Home Financials are based on the most recent Mortgage that was taken out on this home.
Original Mortgage
$170,000
Interest Rate
4.2%
Mortgage Type
New Conventional
Purchase Details
Closed on
Sep 8, 2003
Sold by
Felty William G
Bought by
Shaw Patricia
Home Financials for this Owner
Home Financials are based on the most recent Mortgage that was taken out on this home.
Original Mortgage
$128,150
Interest Rate
6.18%
Mortgage Type
Unknown
Create a Home Valuation Report for This Property
The Home Valuation Report is an in-depth analysis detailing your home's value as well as a comparison with similar homes in the area
Home Values in the Area
Average Home Value in this Area
Purchase History
| Date | Buyer | Sale Price | Title Company |
|---|---|---|---|
| Bh Capital Llc | $249,000 | None Listed On Document | |
| Shaw Ronald | $200,000 | Attorney | |
| Shaw Patricia | $140,000 | Chicago Title Insurance Co |
Source: Public Records
Mortgage History
| Date | Status | Borrower | Loan Amount |
|---|---|---|---|
| Open | Bh Capital Llc | $179,000 | |
| Previous Owner | Shaw Ronald | $118,000 | |
| Previous Owner | Shaw Ronald | $170,000 | |
| Previous Owner | Lochner Jerome | $93,000 | |
| Previous Owner | Shaw Patricia L | $32,227 | |
| Previous Owner | Shaw Patricia | $128,150 |
Source: Public Records
Tax History Compared to Growth
Tax History
| Year | Tax Paid | Tax Assessment Tax Assessment Total Assessment is a certain percentage of the fair market value that is determined by local assessors to be the total taxable value of land and additions on the property. | Land | Improvement |
|---|---|---|---|---|
| 2024 | $5,068 | $77,040 | $14,640 | $62,400 |
| 2023 | $5,068 | $70,040 | $13,310 | $56,730 |
| 2022 | $4,687 | $64,560 | $12,270 | $52,290 |
| 2021 | $4,432 | $61,020 | $11,600 | $49,420 |
| 2020 | $4,351 | $60,000 | $11,410 | $48,590 |
| 2019 | $3,839 | $59,050 | $11,230 | $47,820 |
| 2018 | $3,718 | $57,780 | $10,990 | $46,790 |
| 2017 | $3,543 | $55,030 | $10,470 | $44,560 |
| 2016 | $3,525 | $55,030 | $10,470 | $44,560 |
| 2015 | $4,434 | $55,030 | $10,470 | $44,560 |
| 2014 | $3,935 | $55,030 | $10,470 | $44,560 |
| 2013 | $3,528 | $55,030 | $10,470 | $44,560 |
Source: Public Records
Map
Nearby Homes
- 703 N Northridge Dr
- 206 Evergreen Ct
- 304 Timberview Dr
- 608 W Dunbar St
- 601 W Dunbar St
- 204 W Dunbar St
- 1304 Woodland Ct
- 214 Augusta St
- 308 S Division St
- 1212 Edgeview Dr
- 417 E State St
- 902 S Marietta Dr
- 1607 W Point Dr
- 1506 River Bluff Ct
- 1103 S Clapper Ct
- 1511 River Bluff Ct
- 1007 Briarcliff Dr
- 1604 Morel Ct
- 203 N Eastwood Dr
- 2737 County Road 380 E
- 305 N Raymond Dr
- 303 N Raymond Dr
- 401 N Raymond Dr
- 507 Richard Ct
- 301 N Raymond Dr
- 508 Richard Ct
- 602 W Dianne Ln
- 501 N Raymond Dr
- 505 Richard Ct
- 302 N Raymond Dr
- 604 W Dianne Ln
- 506 Richard Ct
- 508 W Dianne Ln
- 502 N Raymond Dr
- 603 Dianne Ct Unit A
- 603 Dianne Ct Unit B
- 603 Dianne Ct
- 606 W Dianne Ln
- 605 Dianne Ct
- 509 W Craig Dr