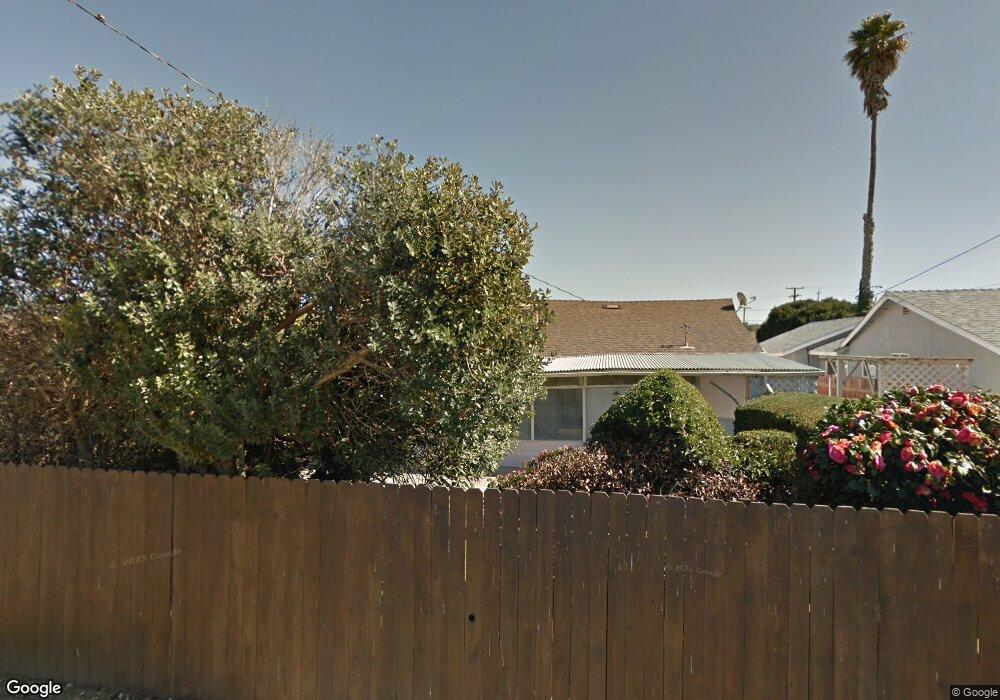
305 N W St Lompoc, CA 93436
Estimated Value: $533,151 - $548,000
3
Beds
2
Baths
1,452
Sq Ft
$372/Sq Ft
Est. Value
About This Home
This home is located at 305 N W St, Lompoc, CA 93436 and is currently estimated at $540,038, approximately $371 per square foot. 305 N W St is a home located in Santa Barbara County with nearby schools including Clarence Ruth Elementary School, Lompoc Valley Middle School, and Lompoc High School.
Ownership History
Date
Name
Owned For
Owner Type
Purchase Details
Closed on
Aug 20, 2019
Sold by
Byrd Robert and Byrd Richard
Bought by
Rubio Omar and Rubio Yesenia E
Current Estimated Value
Home Financials for this Owner
Home Financials are based on the most recent Mortgage that was taken out on this home.
Original Mortgage
$334,650
Outstanding Balance
$292,485
Interest Rate
3.6%
Mortgage Type
New Conventional
Estimated Equity
$247,553
Purchase Details
Closed on
Jan 4, 2007
Sold by
Ridgeway Doris L and Byrd Doris L
Bought by
Ridgeway Paul S and Ridgeway Doris L
Create a Home Valuation Report for This Property
The Home Valuation Report is an in-depth analysis detailing your home's value as well as a comparison with similar homes in the area
Home Values in the Area
Average Home Value in this Area
Purchase History
| Date | Buyer | Sale Price | Title Company |
|---|---|---|---|
| Rubio Omar | $345,000 | Fidelity National Title Co | |
| Ridgeway Paul S | -- | None Available |
Source: Public Records
Mortgage History
| Date | Status | Borrower | Loan Amount |
|---|---|---|---|
| Open | Rubio Omar | $334,650 |
Source: Public Records
Tax History
| Year | Tax Paid | Tax Assessment Tax Assessment Total Assessment is a certain percentage of the fair market value that is determined by local assessors to be the total taxable value of land and additions on the property. | Land | Improvement |
|---|---|---|---|---|
| 2025 | $4,041 | $377,302 | $109,362 | $267,940 |
| 2023 | $4,041 | $362,653 | $105,116 | $257,537 |
| 2022 | $3,969 | $355,543 | $103,055 | $252,488 |
| 2021 | $4,011 | $348,573 | $101,035 | $247,538 |
| 2020 | $3,968 | $345,000 | $100,000 | $245,000 |
| 2019 | $601 | $54,776 | $13,437 | $41,339 |
| 2018 | $590 | $53,703 | $13,174 | $40,529 |
| 2017 | $577 | $52,651 | $12,916 | $39,735 |
| 2016 | $565 | $51,619 | $12,663 | $38,956 |
| 2014 | $550 | $49,849 | $12,229 | $37,620 |
Source: Public Records
Map
Nearby Homes
- 112 N X St
- 1408 W Walnut Ave
- 1445 Crown Cir
- 1355 Crown Cir
- 1410 W Apricot Ave
- 516 N U St
- 267 Village Circle Dr
- 60 Village Circle Dr
- 225 Village Circle Dr
- 23 Village Circle Dr
- 1011 W Walnut Ave
- 1220 W Lime Ave
- 531 N O St
- 217 N M St
- 4314 W Ocean Ave
- 413 S O Place
- 524 Avalon St
- 321 N K St
- 1328 W Willow Ave
- 526 N L St
Your Personal Tour Guide
Ask me questions while you tour the home.