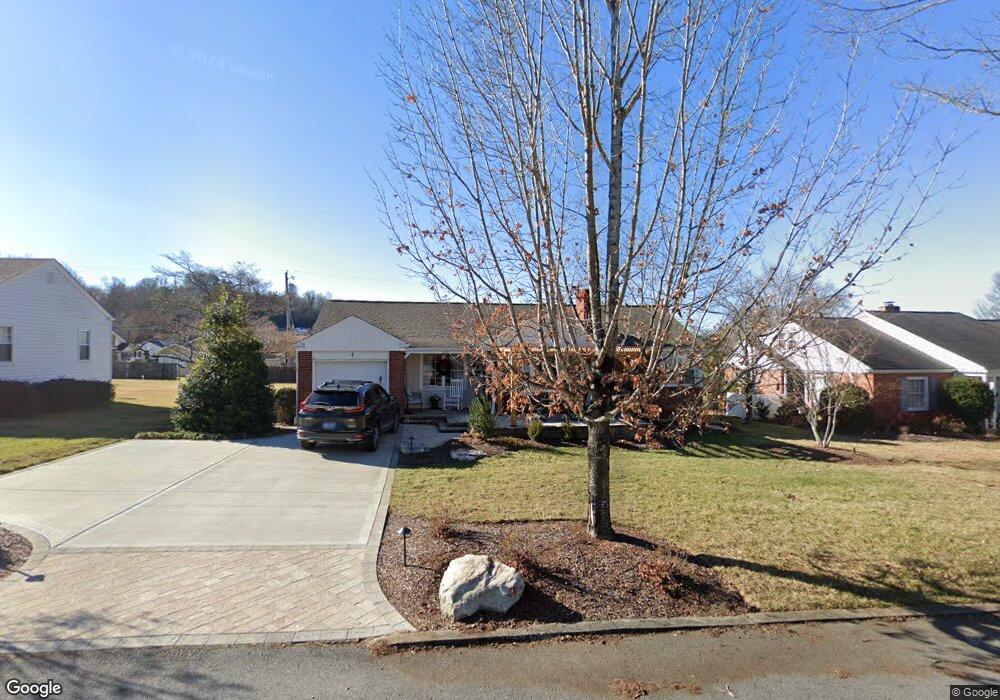
305 Paty Place Elizabethton, TN 37643
Estimated Value: $240,000 - $264,000
3
Beds
2
Baths
1,308
Sq Ft
$193/Sq Ft
Est. Value
About This Home
This home is located at 305 Paty Place, Elizabethton, TN 37643 and is currently estimated at $252,392, approximately $192 per square foot. 305 Paty Place is a home located in Carter County with nearby schools including Elizabethton High School and East Tn Christian Home & Academy.
Ownership History
Date
Name
Owned For
Owner Type
Purchase Details
Closed on
Sep 14, 2010
Sold by
Cole Kenneth H
Bought by
Caudill Charlotte S
Current Estimated Value
Home Financials for this Owner
Home Financials are based on the most recent Mortgage that was taken out on this home.
Original Mortgage
$96,050
Outstanding Balance
$64,066
Interest Rate
4.64%
Estimated Equity
$188,326
Purchase Details
Closed on
Oct 21, 2009
Sold by
Mcewen Patricia
Bought by
Cole Kenneth H
Home Financials for this Owner
Home Financials are based on the most recent Mortgage that was taken out on this home.
Original Mortgage
$100,700
Interest Rate
5.01%
Purchase Details
Closed on
Jun 17, 2008
Sold by
Austin Sarah E
Bought by
Mcewen Patricia
Purchase Details
Closed on
Mar 23, 2000
Sold by
Austin Anne H
Bought by
Austin James R
Purchase Details
Closed on
Nov 25, 1997
Bought by
Austin James R and Austin Anne H
Purchase Details
Closed on
Sep 20, 1950
Bought by
Austin James P and Austin Anne H
Create a Home Valuation Report for This Property
The Home Valuation Report is an in-depth analysis detailing your home's value as well as a comparison with similar homes in the area
Home Values in the Area
Average Home Value in this Area
Purchase History
| Date | Buyer | Sale Price | Title Company |
|---|---|---|---|
| Caudill Charlotte S | $113,000 | -- | |
| Cole Kenneth H | $125,900 | -- | |
| Mcewen Patricia | $80,000 | -- | |
| Austin James R | $35,000 | -- | |
| Austin James R | $35,000 | -- | |
| Austin James P | -- | -- |
Source: Public Records
Mortgage History
| Date | Status | Borrower | Loan Amount |
|---|---|---|---|
| Open | Austin James P | $96,050 | |
| Previous Owner | Austin James P | $100,700 |
Source: Public Records
Tax History Compared to Growth
Tax History
| Year | Tax Paid | Tax Assessment Tax Assessment Total Assessment is a certain percentage of the fair market value that is determined by local assessors to be the total taxable value of land and additions on the property. | Land | Improvement |
|---|---|---|---|---|
| 2024 | $1,190 | $36,050 | $8,525 | $27,525 |
| 2023 | $1,190 | $36,050 | $0 | $0 |
| 2022 | $1,298 | $36,050 | $8,525 | $27,525 |
| 2021 | $732 | $36,050 | $8,525 | $27,525 |
| 2020 | $1,228 | $36,050 | $8,525 | $27,525 |
| 2019 | $1,228 | $28,425 | $5,775 | $22,650 |
| 2018 | $1,211 | $28,425 | $5,775 | $22,650 |
| 2017 | $1,211 | $28,425 | $5,775 | $22,650 |
| 2016 | $1,205 | $28,425 | $5,775 | $22,650 |
| 2015 | $1,208 | $28,425 | $5,775 | $22,650 |
| 2014 | $1,199 | $28,075 | $5,775 | $22,300 |
Source: Public Records
Map
Nearby Homes
- 404 Allen Ave
- 201 Ridgecrest Dr
- 304 Ridgecrest Dr
- 115 W F St
- 116 E G St
- 511 S Watauga Ave
- 229 W Doe Ave
- 112 S Watauga Ave
- 304 E H St
- 621 Mcarthur Ave
- 612 S Lynn Ave
- 722 S Watauga Ave
- 705 Holston Ave
- 210 E Cottage Ave
- 398 River Island Ln
- 503 Florence St
- 309 Elm St
- 308 E Cottage Ave
- 1005 S 2nd St
- 304 Merry Dr
- 301 Paty Place
- 309 Paty Place
- 300 Daytona Place
- 216 Daytona Place
- 216 Daytona Place
- 313 Paty Place
- 302 Daytona Place
- 304 Paty Place
- 300 Paty Place
- 310 Paty Place
- 304 Daytona Place
- 405 W H St
- 401 Paty Place
- 312 Paty Place
- 106 Daytona Place
- 00 Daytona Place
- TBD Daytona Place
- 306 Daytona Place
- 400 Paty Place
- 408 W G St