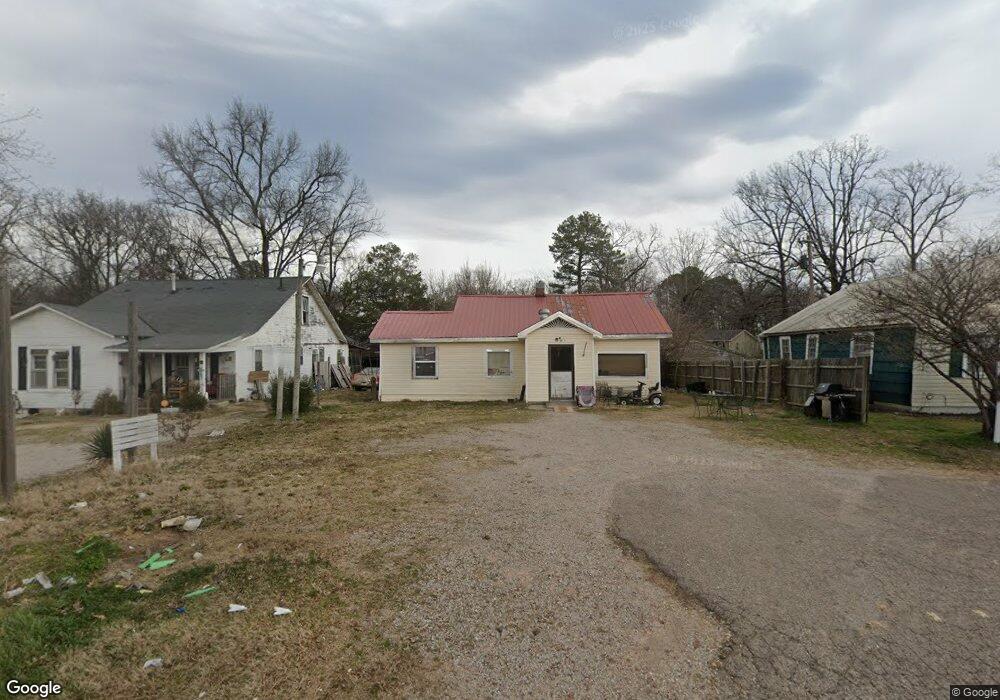
305 Pinhookl Rd Savannah, TN 38372
Estimated Value: $91,303
--
Bed
1
Bath
1,422
Sq Ft
$64/Sq Ft
Est. Value
About This Home
This home is located at 305 Pinhookl Rd, Savannah, TN 38372 and is currently estimated at $91,303, approximately $64 per square foot. 305 Pinhookl Rd is a home located in Hardin County with nearby schools including Hardin County High School and Hardin County Christian School.
Ownership History
Date
Name
Owned For
Owner Type
Purchase Details
Closed on
Mar 23, 2018
Sold by
Meehl Christopher Adam
Bought by
Jerrolds Wayne
Current Estimated Value
Purchase Details
Closed on
Jun 14, 2010
Sold by
Hulen Terry W
Bought by
Meehl Christopher
Home Financials for this Owner
Home Financials are based on the most recent Mortgage that was taken out on this home.
Original Mortgage
$29,509
Interest Rate
4.91%
Mortgage Type
Commercial
Purchase Details
Closed on
Oct 31, 2007
Sold by
Neill Jimmy
Bought by
Hulen Terry W
Home Financials for this Owner
Home Financials are based on the most recent Mortgage that was taken out on this home.
Original Mortgage
$35,137
Interest Rate
6.26%
Mortgage Type
Commercial
Purchase Details
Closed on
Jul 25, 2002
Sold by
Liberty Investments
Bought by
Jimmy Neill
Purchase Details
Closed on
May 23, 2002
Sold by
Rogers James W
Bought by
Liberty Investments
Purchase Details
Closed on
May 28, 1993
Bought by
Mcfalls Charles M and Mcfalls Margaret
Purchase Details
Closed on
Jul 6, 1987
Bought by
Rich James D and Rich Beatrice
Purchase Details
Closed on
Nov 9, 1982
Bought by
Russom Mazie H
Purchase Details
Closed on
Sep 28, 1954
Create a Home Valuation Report for This Property
The Home Valuation Report is an in-depth analysis detailing your home's value as well as a comparison with similar homes in the area
Home Values in the Area
Average Home Value in this Area
Purchase History
| Date | Buyer | Sale Price | Title Company |
|---|---|---|---|
| Jerrolds Wayne | -- | -- | |
| Meehl Christopher | $33,563 | -- | |
| Hulen Terry W | $30,000 | -- | |
| Jimmy Neill | $18,000 | -- | |
| Liberty Investments | $16,250 | -- | |
| Mcfalls Charles M | -- | -- | |
| Rich James D | -- | -- | |
| Russom Mazie H | -- | -- | |
| -- | -- | -- |
Source: Public Records
Mortgage History
| Date | Status | Borrower | Loan Amount |
|---|---|---|---|
| Previous Owner | Not Available | $29,509 | |
| Previous Owner | Not Available | $35,137 |
Source: Public Records
Tax History Compared to Growth
Tax History
| Year | Tax Paid | Tax Assessment Tax Assessment Total Assessment is a certain percentage of the fair market value that is determined by local assessors to be the total taxable value of land and additions on the property. | Land | Improvement |
|---|---|---|---|---|
| 2024 | $522 | $21,320 | $3,200 | $18,120 |
| 2023 | $522 | $21,320 | $3,200 | $18,120 |
| 2022 | $447 | $16,200 | $3,000 | $13,200 |
| 2021 | $447 | $16,200 | $3,000 | $13,200 |
| 2020 | $447 | $16,200 | $3,000 | $13,200 |
| 2019 | $447 | $16,200 | $3,000 | $13,200 |
| 2018 | $436 | $16,200 | $3,000 | $13,200 |
| 2017 | $425 | $15,280 | $3,000 | $12,280 |
| 2016 | $425 | $15,280 | $3,000 | $12,280 |
| 2015 | $385 | $15,280 | $3,000 | $12,280 |
| 2014 | $385 | $15,280 | $3,000 | $12,280 |
Source: Public Records
Map
Nearby Homes
- 105 Pinhook Dr
- 190 Turner Kyle Dr
- 530 Main St E
- 25 Northcutt St
- 0 High Pointe Dr Unit 10202679
- 6 High Pointe Dr
- 7 High Pointe Dr
- 10 Deberry St
- 230 White St
- 80 Northcutt St
- 171 White St
- 00 Enoch Blvd
- 710 Main St E
- 13305 U S Highway 64
- 80 Quartet Cir
- 0 Hwy 128 Hwy Unit LotWP001 22873478
- 0 Hwy 128 Hwy Unit RTC2801964
- 0 Hwy 128 Hwy Unit 10143254
- 7085 Cravens Rd
- 870 Main St E
- 305 Pinhook Dr
- 295 Pinhook Dr
- 315 Pinhook Dr
- 580 Fairground St
- 430 Fairground St
- 285 Pinhook Dr
- 420 Fairground St
- 410 Fairground St
- 300 Pinhook Dr
- 465 Fairground St
- 255 Pinhook Dr
- 425 Fairground St
- 435 Fairground St
- 395 Fairground St
- 45 Cromwell St
- 245 Pinhook Dr
- 250 Pinhook Dr
- 65 Cromwell St
- 525 Malcomb St
- 245 Deberry St