Estimated Value: $249,366 - $283,000
3
Beds
2
Baths
1,222
Sq Ft
$217/Sq Ft
Est. Value
About This Home
This home is located at 305 Riverside Chase Cir, Greer, SC 29650 and is currently estimated at $264,842, approximately $216 per square foot. 305 Riverside Chase Cir is a home located in Greenville County with nearby schools including Woodland Elementary School, Riverside Middle School, and Riverside High School.
Ownership History
Date
Name
Owned For
Owner Type
Purchase Details
Closed on
Mar 23, 2022
Sold by
Baker Anne S
Bought by
Anne S Baker Living Trust
Current Estimated Value
Purchase Details
Closed on
Jun 2, 2006
Sold by
Andrews Marsha
Bought by
Baker Anne S
Home Financials for this Owner
Home Financials are based on the most recent Mortgage that was taken out on this home.
Original Mortgage
$94,000
Interest Rate
6.5%
Mortgage Type
Purchase Money Mortgage
Purchase Details
Closed on
Mar 21, 2006
Sold by
Regions Bank
Bought by
Andrews Marsha
Home Financials for this Owner
Home Financials are based on the most recent Mortgage that was taken out on this home.
Original Mortgage
$91,500
Interest Rate
8%
Mortgage Type
Seller Take Back
Purchase Details
Closed on
Nov 8, 2005
Sold by
Dill John Stanley
Bought by
Regions Bank
Create a Home Valuation Report for This Property
The Home Valuation Report is an in-depth analysis detailing your home's value as well as a comparison with similar homes in the area
Home Values in the Area
Average Home Value in this Area
Purchase History
| Date | Buyer | Sale Price | Title Company |
|---|---|---|---|
| Anne S Baker Living Trust | -- | None Listed On Document | |
| Baker Anne S | $117,500 | None Available | |
| Andrews Marsha | $102,500 | None Available | |
| Regions Bank | $2,500 | -- |
Source: Public Records
Mortgage History
| Date | Status | Borrower | Loan Amount |
|---|---|---|---|
| Previous Owner | Baker Anne S | $94,000 | |
| Previous Owner | Andrews Marsha | $91,500 |
Source: Public Records
Tax History
| Year | Tax Paid | Tax Assessment Tax Assessment Total Assessment is a certain percentage of the fair market value that is determined by local assessors to be the total taxable value of land and additions on the property. | Land | Improvement |
|---|---|---|---|---|
| 2025 | $1,050 | $5,890 | $1,700 | $4,190 |
| 2024 | $1,050 | $5,120 | $940 | $4,180 |
| 2023 | $919 | $5,120 | $940 | $4,180 |
| 2022 | $861 | $5,120 | $940 | $4,180 |
| 2021 | $831 | $5,120 | $940 | $4,180 |
| 2020 | $706 | $4,450 | $820 | $3,630 |
| 2019 | $700 | $4,450 | $820 | $3,630 |
| 2018 | $693 | $4,450 | $820 | $3,630 |
| 2017 | $684 | $4,450 | $820 | $3,630 |
| 2016 | $1,083 | $111,370 | $20,500 | $90,870 |
| 2015 | $1,043 | $111,370 | $20,500 | $90,870 |
| 2014 | $1,089 | $117,330 | $23,500 | $93,830 |
Source: Public Records
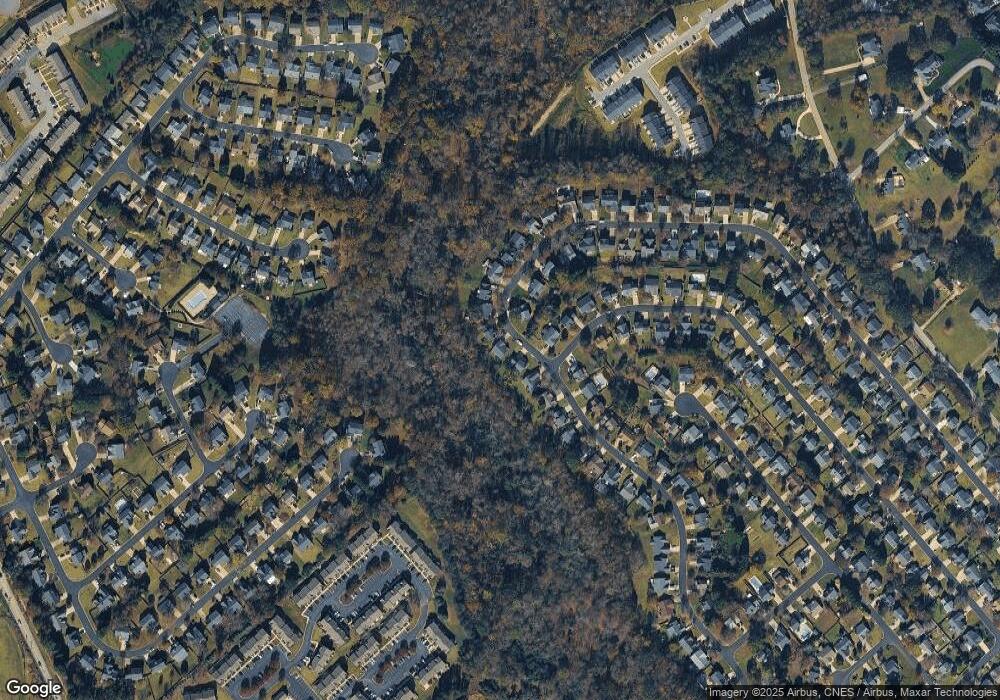
Map
Nearby Homes
- 133 Fawnbrook Dr
- 145 Spring Crossing Cir
- 100 Grey Oak Trail
- 44 Riley Eden Ln
- 220 Spring Crossing Cir
- 68 Riley Eden Ln Unit Site 3
- 76 Riley Eden Ln Unit Site 1
- 208 Elise Dr
- 34 Swade Way
- 519 Longview Terrace
- 12 Sabine Leaf Ct
- 107 Kingscreek Dr
- 109 Quail Creek Dr
- 6 Kylemore Ln
- 203 Quail Creek Dr
- 213 Kingscreek Dr
- 505 Meadow Hill Way
- 8 Sunfield Ct
- 219 Meadow Lake Trail
- 131 A Dillard Dr
- 303 Riverside Chase Cir
- 307 Riverside Chase Cir
- 301 Riverside Chase Cir
- 309 Riverside Chase Cir
- 304 Riverside Chase Cir
- 156 Fawnbrook Dr
- 311 Riverside Chase Cir
- 239 Riverside Chase Cir
- 306 Riverside Chase Cir
- 154 Fawnbrook Dr
- 228 Riverside Chase Cir
- 313 Riverside Chase Cir
- 229 Riverside Chase Cir
- 308 Riverside Chase Cir
- 152 Fawnbrook Dr
- 315 Riverside Chase Cir
- 226 Riverside Chase Cir
- 149 Fawnbrook Dr
- 227 Riverside Chase Cir
- 224 Riverside Chase Cir
Your Personal Tour Guide
Ask me questions while you tour the home.